2025 2H Announcement: Next LogicMonitor Innovations Unveiled
This update is packed with enhancements designed to help you troubleshoot faster, scale smarter, and integrate deeper. If you build, fix, or integrate with LogicMonitor every day, you’ll want to dive into these new capabilities. Expanding Best-in-Class Hybrid Observability LogicMonitor already leads the way in hybrid coverage, and we’re taking it further with Oracle Cloud Infrastructure (OCI) monitoring. Now you can view OCI alongside AWS, Azure, and GCP—all within LM Envision. That means: No more custom scripts. No more blind spots. Seamless, side-by-side visibility across your multi-cloud stack. For engineers, this means easier cloud comparisons and correlation. For your business, it reduces tool sprawl and ensures fewer gaps in observability. Accelerating Troubleshooting Troubleshooting gets a boost with new automation and visualization: Automated Diagnostics Diagnostics like traceroutes, interface stats, and top CPU processes now run automatically the moment an alert fires. Topology Edge Status Color-coded topology maps provide instant visibility into network health. These enhancements cut down mean time to resolution (MTTR), reduce escalations, and strengthen SLA performance. Optimizing Insights & Resolution with Edwin AI This release elevates Edwin AI into a true proactive AI Agent by: Executing remediation workflows through orchestration tools. Leveraging your Knowledge Base for customer-specific context. Integrating directly with IT Service Management tools like ServiceNow, Jira, PagerDuty, and BigPanda. Smarter Event Intelligence Powered by anomaly models and topology-based correlation—makes Edwin AI even more effective. The result? Lower MTTR, reduced burnout, and AI that actually helps when things break. Unlocking Dynamic & Interactive Visualizations If dashboards are your daily workspace, this one’s for you: LMQL-powered widget actions Now, you can drill down, filter, and pivot in real time without rebuilding dashboards. Improved reports Cleaner UX, better summaries, and dynamic formatting. This makes ad-hoc investigations faster and surfaces trends without needing external business intelligence tools. Delivering App Visibility for ITOps We’re introducing three key features that bring application-level visibility to ITOps teams: Dynamic Service Insights Define services with rules and filters, getting instant health status without manual setup. LM Uptime Website checks now appear as first-class resources, complete with dashboards and alerts. Log Metricization Convert log events into metrics you can trend, alert on, and report against. Together, these updates move teams from “Is it broken?” to “What’s the customer impact?” in seconds. 🔔 Coming soon: We’re also rolling out a new badge on Service Insights to make service health and dependencies even more visible at a glance. Stay tuned for details in the Community! Resources & Next Steps To dig deeper into the release, we’ve got you covered: 📢 Read the full announcement blog for all the details. 🌐 Explore our new product pages for in-depth looks at these features Dynamic Service Insights Edwin AI LM Uptime Oracle Cloud Infrastructure Monitoring 🎥 Register for the 2H 2025 Release Webinar to see live demos, ask questions, and get a guided walkthrough of what’s new. These updates are built for the engineers, operators, and teams who keep systems optimized and scalable every day. 👉 Log in to your LM Envision portal to explore the new features. 👉 Join the LogicMonitor Community to share your own use cases and learn from peers. Here’s to smarter observability in 2H 2025.203Views4likes2Comments
How to Create a Dashboard Widget for “Sensitive” Windows Servers?
Hi Community, I’m looking for best practices to create a dashboard widget that highlights Windows servers which are more “problematic” or sensitive—for example, servers that frequently trigger CPU, Memory, or Disk alerts. Goal: Identify servers with high alert frequency or severe resource issues. Display them in a widget so they stand out for quick troubleshooting.24Views1like1Comment
Can I create a dashboard that let's the user pick which groups of servers they want to see?
Hi, We have servers in the US and in Canada. We also have various types of servers such as App, Web, etc. I have users who need to see the CPU and Memory for a certain group of servers together. E.g. alll the US App servers or the Canada Web servers. Is there any way to do this with a single dashboard that would somehow allow the user to specify which servers or server group they want to see at the top and it would then update all the widgets on the dashboard to show those servers? I currently have a dashboard for US App, US Web, CA App, CA Web, etc. They are all hard coded to the proper servers. I was hoping for a way they coudl either: Pick from a dropdown list of which type of server they want, and the widgets would then update to show those predefined servers. type in their own filter like US-APP* and have the widgets update to reflect the proper servers. Is anything like that possible? Thanks.17Views0likes1Commentdashboard display user timeout override
We have several ( hundreds of ) dashboards which show pertinent data to the relevant teams here. Each set of teams sit in separate areas, and they all need to see their dashboards. As such, we have set up dashboard stations ( computers with a bunch of screens attached ) so they can put all their dashboards in their own areas on a specific wall etc.. The only portal which is timing out is the LogicMonitor portal. Is there any way to override a specific account to not be bound by the portal settings for idle logons? We need to keep our. timeout settings as 4 hrs for all other users, but these specific screens need to remain forever not being logged out ( as much as is possible ) Is it possible to have a per-account override for “user session timeout” ?228Views7likes8CommentsLogicMonitor’s Dashboard Directory
Do you love the visibility that comes with creating an informative dashboard but don’t know where to start or what’s available in LM Envision? We have a solution! The LM Envision Dashboard Directory page is your go-to hub for exploring all available dashboard categories, making monitoring critical IT infrastructure in one place easier than ever. Comprehensive visibility into networks, servers, cloud environments, and applications ensures you stay informed about system performance. Dynamic widgets like time-series graphs, pie charts, heat maps, and topology maps transform raw data into clear, actionable intelligence. Recent improvements allow text data to be displayed alongside metrics, adding valuable context for faster troubleshooting and decision-making. These dashboards are more than just a pretty interface for technical teams—they’re a powerful tool to streamline monitoring and observability. By consolidating multiple data streams into a single, customizable view, teams can reduce context-switching, accelerate issue resolution, and improve system performance. Advanced AIOps capabilities, including early warning detection and root cause analysis, help prevent issues before they escalate, minimizing downtime and enhancing operational efficiency. Example: Dashboard Categories Relevant Dashboards and Widgets Business Value & User Impact Real-Time Performance Monitoring Applications Dashboards CPU utilization memory usage Network Dashboards geographical map provides immediate operational visibility, enabling teams to quickly identify and resolve bottlenecks AI-Driven Root Cause Analysis LM Intelligence Dashboards Anomaly Detection Datasource Analysis Log Analysis facilitate rapid problem resolution and minimize downtime by quickly identifying the underlying causes of incidents. Cloud Monitoring Cloud Dashboards AWS/Azure/GCP Monitor Overview EC2 Virtual Machine Performance Cloud Functions ensure cloud performance and reliability, proactively preventing outages that could disrupt business operations and user access. Network Monitoring Network Dashboards Topology mapping Device Health WAN Performance guarantee network availability and optimal performance, ensuring seamless connectivity for users and applications, and facilitating rapid troubleshooting of network issues Ready to take control of your IT environment? Check out the LM Envision Dashboards page to explore all the possibilities!181Views2likes0Comments
NOC Rollup Status Dashboards for MSPs
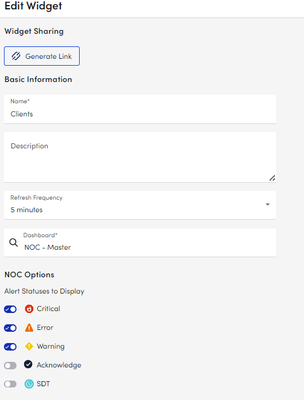
LM doesn't come with it out of the box, so I built the NOC Dashboard I've wanted. It provides high level, at-a-glance health indicators for each of our client environments we manage. This makes a great "big board" for a NOC room or a second screen status board for work from home NOC/Support folks. I do have three examples in this code for ways to filter for specific teams/purposes. This all collapses for ease of reference correctly in Powershell ISE on windows. Line 282 references a dataSource I wrote that counts frequency of specific eventlog events to illustrate potential brute force attempts (CTM are my initials, we tag our scripts to make finding the best source of answers faster in the future - old habit from pen & paper change logs from a previous job). As any screenshots would contain client names, I'm unable to post any screen shots of the results of this, but my current settings for my Main dashboard are (This is the first Dashboard I've made that looks better in UIv4 than 3): ... #!!! These two need to be changed. First is a string, second an integer #!!! See the comment block below for instructions # The first chunk of your company's logicmonitor URL $company = "yourCompanyNameHere" # ID of the group to be used as a source for the NOC widget items $parentGroupID = <parentGroupID> <# Netgain Technology, llc ( https://netgaincloud.com ) 2/26/2024 - Developed by Cole McDonald Disclaimer: Neither Netgain nor Cole McDonald are not responsible for any unexpected results this script may cause in your environment. To deploy this: - COLLECTOR: you will need a collector for scripting, this will be the single applies to target. You may need to increase the script timeout depending on the size of your device deployment. - DASHBOARD: you will need a Dashboard with a NOC widget on it. The name can be whatever you'd like, there will be a name change in the "name" property for the initial array. In the case of the first example here, "NOC - Master" - PARENT GROUP: you will need to identify the ID# of the group you wish to use as the source for the subgroup list and set the $parentGroupID to the appropriate ID# Purpose: Create an auto-updating high level NOC dashboard that can show - Rollup state for a list of client subgroups from our \Clients group - Group Indicators for a specific dataSource - Group indicators for a subset of devices within each group After the API region, there are three separate dashboards referenced to illustrate the 3 methods for using this dataSource. NOTE: my code uses backticks for line continuation. Where possible in my code, each line indicates a single piece of information about the script's algorithm and the first character in each line from a block indicates the line's relationship to the one above it. #> #region Rest API Initialization and Functions # Init variables used in the RESTApi functions $URLBase = "https://$company.logicmonitor.com/santaba/rest" $accessID = "##ApiAccessID.key##" $accessKey = "##ApiAccessKey.key##" #-------- The Functions ---------- function Send-Request { param ( $cred , $URL , $accessid = $null, $accesskey = $null, $data = $null, $version = '3' , $httpVerb = "GET" ) if ( $accessId -eq $null) { exit 1 } <# Use TLS 1.2 #> [Net.ServicePointManager]::SecurityProtocol = [Net.SecurityProtocolType]::Tls12 <# Get current time in milliseconds #> $epoch = [Math]::Round( ( New-TimeSpan ` -start (Get-Date -Date "1/1/1970") ` -end (Get-Date).ToUniversalTime()).TotalMilliseconds ) <# Concatenate Request Details #> $requestVars = $httpVerb + $epoch + $data + $resourcePath <# Construct Signature #> $hmac = New-Object System.Security.Cryptography.HMACSHA256 $hmac.Key = [Text.Encoding]::UTF8.GetBytes( $accessKey ) $signatureBytes = $hmac.ComputeHash( [Text.Encoding]::UTF8.GetBytes( $requestVars ) ) $signatureHex = [System.BitConverter]::ToString( $signatureBytes ) -replace '-' $signature = [System.Convert]::ToBase64String( [System.Text.Encoding]::UTF8.GetBytes( $signatureHex.ToLower() ) ) <# Construct Headers #> $auth = 'LMv1 ' + $accessId + ':' + $signature + ':' + $epoch $headers = New-Object "System.Collections.Generic.Dictionary[[String],[String]]" $headers.Add( "Authorization", $auth ) $headers.Add( "Content-Type" , 'application/json' ) # uses version 2 of the API $headers.Add( "X-version" , $version ) <# Make Request #> $response = Invoke-RestMethod ` -Uri $URL ` -Method $httpVerb ` -Body $data ` -Header $headers ` -erroraction SilentlyContinue ` -warningaction SilentlyContinue Return $response } function Get-LMRestAPIObjectListing { param ( $URLBase , $resourcePathRoot , # "/device/devices" $size = 1000 , $accessKey , $accessId , $version = '2' ) $output = @() $looping = $true $counter = 0 while ($looping) { #re-calc offset based on iteration $offset = $counter * $size $resourcePath = $resourcePathRoot $queryParam = "?size=$size&offset=$offset" $url = $URLBase + $resourcePath + $queryParam # Make Request $response = Send-Request ` -accesskey $accessKey ` -accessid $accessId ` -URL $url ` -version $version if ( $response.items.count -eq $size ) { # Return set is full, more items to retrieve $output += $response.items $counter++ } elseif ( $response.items.count -gt 0 ) { # Return set is not full, store date, end loop $output += $response.items $looping = $false } else { # Return set is empty, no data to store, end loop $looping = $false } } write-output $output } # Get Dashboards $resourcePath = "/dashboard/dashboards" $dashboards = Get-LMRestAPIObjectListing ` -resourcePathRoot $resourcePath ` -accessKey $accessKey ` -accessId $accessID ` -URLBase $URLBase # Get Widgets $resourcePath = "/dashboard/widgets" $widgets = Get-LMRestAPIObjectListing ` -resourcePathRoot $resourcePath ` -accessKey $accessKey ` -accessId $accessID ` -URLBase $URLBase # Get Groups $resourcePath = "/device/groups" $Groups = Get-LMRestAPIObjectListing ` -resourcePathRoot $resourcePath ` -accessKey $accessKey ` -accessId $accessID ` -URLBase $URLBase #endregion function generateJSON { param( $dashInfo, $clientnames, $deviceDisplayName = "*", $DSDisplayName = "*" ) $itemArray = @() foreach ($name in $clientnames) { $itemArray += @{ "type" = "device" "deviceGroupFullPath" = "Clients/$name" "deviceDisplayName" = $deviceDisplayName "dataSourceDisplayName" = $DSDisplayName "instanceName" = "*" "dataPointName" = "*" "groupBy" = "deviceGroup" "name" = "`#`#RESOURCEGROUP`#`#" } } # Write JSON back to the API for that widget $outputJSON = "`n`t{`n`t`t`"items`" : [`n" foreach ($item in $itemArray) { $elementJSON = @" { `"type`" : `"$($item.type)`", `"dataPointName`" : `"$($item.dataPointName)`", `"instanceName`" : `"$($item.instanceName)`", `"name`" : `"$($item.name)`", `"dataSourceDisplayName`" : `"$($item.dataSourceDisplayName)`", `"groupBy`" : `"$($item.groupBy)`", `"deviceGroupFullPath`" : `"$($item.deviceGroupFullPath)`", `"deviceDisplayName`" : `"$($item.deviceDisplayName)`" } "@ if ($item -ne $itemArray[-1]) { $outputJSON += "$elementJSON,`n" } else { # Last Item $outputJSON += "$elementJSON`n`t`t]`n`t}" } } write-output $outputJSON } # Get Client Names from groups $clientnames = ( $groups ` | where parentid -eq $parentGroupID ` | where name -notmatch "^\." ).name | sort #ID Master Dashboard # declare dashboard name and set default id and widgetid to use in the loop later $masterDash = @{ id=0; widgetid=0; name="NOC - Master" } $master = $dashboards | ? name -eq $masterDash.name if (($master.name).count -eq 1) { $masterDash.id = $master.id $masterDash.widgetid = $master.widgetsConfig[0].psobject.Properties.name $outputJSON = generateJSON ` -dashInfo $masterDash ` -clientnames $clientnames $resourcePath = "/dashboard/widgets/$($masterDash.widgetid)" $url = $URLBase + $resourcePath $widget = Send-Request ` -accessKey $accessKey ` -accessId $accessID ` -data $outputJSON ` -URL $URL ` -httpVerb "PATCH" } #ID Network Dashboard # declare dashboard name and set default id and widgetid to use in the loop later $networkDash = @{ id=0; widgetid=0; name="NOC - Network" } # preset filters for specific dashboard targeting by device $networkDeviceDisplayNameString = "*(meraki|kemp)*" $network = $dashboards | ? name -eq $networkDash.name if (($network.name).count -eq 1) { $networkDash.id = $network.id $networkDash.widgetid = $network.widgetsConfig[0].psobject.Properties.name $outputJSON = generateJSON ` -dashInfo $networkDash ` -clientnames $clientnames ` -deviceDisplayName $networkDeviceDisplayNameString $resourcePath = "/dashboard/widgets/$($networkDash.widgetid)" $url = $URLBase + $resourcePath $widget = Send-Request ` -accessKey $accessKey ` -accessId $accessID ` -data $outputJSON ` -URL $URL ` -httpVerb "PATCH" } #ID Security Dashboard # declare dashboard name and set default id and widgetid to use in the loop later $securityDash = @{ id=0; widgetid=0; name="NOC - Security" } # preset filters for specific dashboard targeting by datasource $securityDataSourceDisplayNameString = "Event Frequency Sec:4625 CTM" $security = $dashboards | ? name -eq $securityDash.name if (($security.name).count -eq 1) { $securityDash.id = $security.id $securityDash.widgetid = $security.widgetsConfig[0].psobject.Properties.name $outputJSON = generateJSON ` -dashInfo $securityDash ` -clientnames $clientnames ` -DSDisplayName $securityDataSourceDisplayNameString $resourcePath = "/dashboard/widgets/$($securityDash.widgetid)" $url = $URLBase + $resourcePath $widget = Send-Request ` -accessKey $accessKey ` -accessId $accessID ` -data $outputJSON ` -URL $URL ` -httpVerb "PATCH" }365Views3likes5CommentsNew UI Impact Series - Widget Improvements
Here at LogicMonitor, we’ve made some big changes to our dashboard - specifically Widget Improvements. These new widgets are designed to increase the depth and breadth of information available at a glance. One enhancement is the ability to display text data alongside metric data in table widgets. Users can now incorporate property values and instance descriptions within their metric displays, providing crucial context for performance data. For example, when monitoring Kubernetes pods, administrators can now view performance metrics alongside namespace information, enabling quick identification of patterns or issues within specific namespaces. This integration of metadata with performance metrics streamlines the troubleshooting process and enhances overall monitoring efficiency. LogicMonitor is also introducing new log widgets that will allow users to display log data alongside metric data. This upcoming feature will enable users to view log query results in both widget and report formats, providing a more complete picture of system performance and behavior. The impact of these improvements extends beyond mere convenience. By consolidating different types of monitoring data into a single dashboard view, IT teams can make faster, more informed decisions. The ability to correlate performance metrics with contextual information like property values and log data reduces the need to switch between different views or tools, ultimately leading to more efficient monitoring and troubleshooting processes. These enhancements demonstrate LogicMonitor's understanding of how IT professionals work and what they need to maintain peak system performance. Want to know more about Widget Improvements? Check out these support documentation: Widgets Overview Widgets Management60Views3likes0CommentsAdding Weather to Map Widgets
LogicMonitor's Map widgets are a great and easy way to plot resources/groups geographically, including their status. A question that comes up occasionally is if it's possible to show weather information on top of these maps. While there's currently not a native option to show weather on a Map widget, it is possible to inject a weather layer onto an existing map with a bit of JavaScript. Below is a link to a sample dashboard that can insert various types of weather info onto Map widgets. Simply save the linked JSON file to your local workstation, then in your LogicMonitor portal go to Dashboards and click Add > From File. Dynamic_Weather_Overlay.json The magic happens in JavaScript embedded in the source of the Text widget. Feel free to explore the source code by entering the Text widget's Configure dialog and clicking the 'Source' button. In typical overkill fashion, I included the option for several different types of weather information. The script looks for the following text (regardless of case) in the Map widget's title and adds the appropriate weather/info layer: "Radar" or "Precip" "NEXRAD Base" "NEXRAD Echo Tops" "MRMS" "Temperature" (OpenWeatherMap.org API key required) "Wind Speed" (OpenWeatherMap.org API key required) "Cloud Cover" or "Satellite" (OpenWeatherMap.org API key required) "fire" (for including perimeters of active wildfires) Prerequisites If you want to use one of the map types noted above as needing an API key (the other types use free APIs that don't require a key), you'll need to register for a free account on OpenWeatherMap.org. Once you've obtained an API key, just add a new dashboard token named 'OpenWeatherAPIKey' and paste your key into its value field. Alternatively, you can also hard-code the key directly in the 'openWeatherMapsAPIKey' variable near the top of the script. The weather overlays should auto-update when the widgets perform their regular timed refresh. For instance, new radar imagery is made available every 10 minutes and will update automatically. Weather sources currently defined within this script: RainViewer.com - Excellent source of global weather imaging data. Updates approx. every 10 minutes. Used by the script for radar/precipitation maps. Open Geospatial Consortium - Hosted by Iowa State University, an excellent free source of weather data. Since it sources data from the US National Weather Service, its data is local just US and Canada. Used by the script for NEXRAD and MRMS data. OpenWeatherMap.org - Good source for some weather data such as wind speed, temperature, and cloud cover. Requires use of an API key, which is available for free. National Interagency Fire Center - For data about active US wildfires. Known Issues: When switching to a different dashboard containing a Map widget, it's possible weather may still be visible on the new dashboard. If that happens just refresh the page.739Views24likes3CommentsDashboard Audit
Hello, Has anyone been auditing on Dashboard usage. We have a lot of dashboards and we want to know dashboard which weren't used for over 30 days. I do not see an API for this, is there another to get this info. Essentially we need find dashboard not being used for over 30 days then, we will mark them private for next 10 days and then remove them. Thanks, AshishSolved277Views6likes10Comments
REST API Device SLA Widget
Hi Portal I am currently automating our SLA reporting and have come across the following issue. When I create a device SLA widget via REST API, I do not have the option "displayPercentageBar". When I make an Inspect in Chrome, for example, I see this setting: However, when I set it via REST API, nothing happens. Has anyone ever had to deal with this? Greetings DorianSolved183Views10likes5Comments