Adding Weather to Map Widgets
LogicMonitor's Map widgets are a great and easy way to plot resources/groups geographically, including their status. A question that comes up occasionally is if it's possible to show weather information on top of these maps. While there's currently not a native option to show weather on a Map widget, it is possible to inject a weather layer onto an existing map with a bit of JavaScript. Below is a link to a sample dashboard that can insert various types of weather info onto Map widgets. Simply save the linked JSON file to your local workstation, then in your LogicMonitor portal go to Dashboards and click Add > From File. Dynamic_Weather_Overlay.json The magic happens in JavaScript embedded in the source of the Text widget. Feel free to explore the source code by entering the Text widget's Configure dialog and clicking the 'Source' button. In typical overkill fashion, I included the option for several different types of weather information. The script looks for the following text (regardless of case) in the Map widget's title and adds the appropriate weather/info layer: "Radar" or "Precip" "NEXRAD Base" "NEXRAD Echo Tops" "MRMS" "Temperature" (OpenWeatherMap.org API key required) "Wind Speed" (OpenWeatherMap.org API key required) "Cloud Cover" or "Satellite" (OpenWeatherMap.org API key required) "fire" (for including perimeters of active wildfires) Prerequisites If you want to use one of the map types noted above as needing an API key (the other types use free APIs that don't require a key), you'll need to register for a free account on OpenWeatherMap.org. Once you've obtained an API key, just add a new dashboard token named 'OpenWeatherAPIKey' and paste your key into its value field. Alternatively, you can also hard-code the key directly in the 'openWeatherMapsAPIKey' variable near the top of the script. The weather overlays should auto-update when the widgets perform their regular timed refresh. For instance, new radar imagery is made available every 10 minutes and will update automatically. Weather sources currently defined within this script: RainViewer.com - Excellent source of global weather imaging data. Updates approx. every 10 minutes. Used by the script for radar/precipitation maps. Open Geospatial Consortium - Hosted by Iowa State University, an excellent free source of weather data. Since it sources data from the US National Weather Service, its data is local just US and Canada. Used by the script for NEXRAD and MRMS data. OpenWeatherMap.org - Good source for some weather data such as wind speed, temperature, and cloud cover. Requires use of an API key, which is available for free. National Interagency Fire Center - For data about active US wildfires. Known Issues: When switching to a different dashboard containing a Map widget, it's possible weather may still be visible on the new dashboard. If that happens just refresh the page.706Views24likes3Comments
Resource Property Filters on the New UI Preview
What exactly is “Resource Property Filters” in the new UI Preview, I tried and tested by creating two filters but I could not make them interdependent or linked to each other example based on what you selected from the first filter will populate set of values in the second filter and so on. I do not see any option to make them interdependent so wondering what exactly is the use, and also are there any plans in to introduce filters in Dashboards? We can use the text widget to see if we can create custom filters but I want to know whether LM development is coming up with advance filters or not.Solved568Views13likes10CommentsDashboards UIv4 is available starting August 23!
We're thrilled to announce an update to enhance your dashboard user experience. With this UIv4 update, we’re introducing an intuitive new design that aligns with the new LM experience, making your dashboard navigation more seamless with other areas of the product. Update the toggle on the top navigation to ‘New UI Preview’ to see the following changes. What's New: 🎨 Revamped User Experience: Our team has been hard at work reimagining the dashboard's visual appeal. With a new skin, your dashboards are now in line with the rest of the UIv4 changes that you’ve become accustomed to. While the core functionality remains intact, new aesthetics that consistency across the platform improve the quality of our LM experience. 🛠️ Enhanced Widget Editing: We've heard your feedback, and we're excited to introduce a new capability to the dashboard widget editing process. Say goodbye to the hassle of publishing a widget to witness changes – you can now preview your modifications in real-time before hitting that publish button. This means you have the power to experiment, tweak, and fine-tune your creations with the confidence of knowing exactly how they'll appear to your dashboard consumers. Thank you for being a part of our beta community. Your insights and feedback have been invaluable in shaping these new changes. We take pride in helping guide our analytics journey and want to get you to your destination in style. As always, your feedback is essential to us, so please don't hesitate to share your thoughts and experiences as you dive into these exciting new features. Stay tuned for more updates, and happy dashboarding! Best regards, Faran - Senior Product Manager for Dashboards and Reporting551Views29likes33Comments
Ability to exclude a device(s)/device groups from a Dashboard widget?
Hi, I am fairly new to LogicMonitor and this is my first time using the community, so forgive me if this has already been asked/answered somewhere.. but is there a way that you can exclude specific devices/device groups from a widget within a dashboard? As an example, I don’t want our File Servers to appear on our Volume Utilization widget as each of the disks will always be operating at 90%+ utilization, so I’d like to at least have to option to exclude them as “known exceptions” if you like. I couldn’t see any logical settings within the widget itself which I could amend to configure this, and I also reported this to customer support team who said that there isn’t currently a global expression which could be applied to the widget in order match our requirement. Does anyone know whether I’m missing a trick here or whether this has is on the LogicMonitor roadmap for the future? Thanks in advance!449Views6likes3Comments
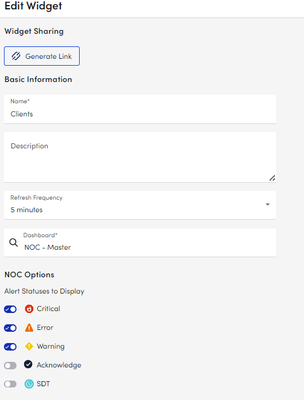
NOC Rollup Status Dashboards for MSPs
LM doesn't come with it out of the box, so I built the NOC Dashboard I've wanted. It provides high level, at-a-glance health indicators for each of our client environments we manage. This makes a great "big board" for a NOC room or a second screen status board for work from home NOC/Support folks. I do have three examples in this code for ways to filter for specific teams/purposes. This all collapses for ease of reference correctly in Powershell ISE on windows. Line 282 references a dataSource I wrote that counts frequency of specific eventlog events to illustrate potential brute force attempts (CTM are my initials, we tag our scripts to make finding the best source of answers faster in the future - old habit from pen & paper change logs from a previous job). As any screenshots would contain client names, I'm unable to post any screen shots of the results of this, but my current settings for my Main dashboard are (This is the first Dashboard I've made that looks better in UIv4 than 3): ... #!!! These two need to be changed. First is a string, second an integer #!!! See the comment block below for instructions # The first chunk of your company's logicmonitor URL $company = "yourCompanyNameHere" # ID of the group to be used as a source for the NOC widget items $parentGroupID = <parentGroupID> <# Netgain Technology, llc ( https://netgaincloud.com ) 2/26/2024 - Developed by Cole McDonald Disclaimer: Neither Netgain nor Cole McDonald are not responsible for any unexpected results this script may cause in your environment. To deploy this: - COLLECTOR: you will need a collector for scripting, this will be the single applies to target. You may need to increase the script timeout depending on the size of your device deployment. - DASHBOARD: you will need a Dashboard with a NOC widget on it. The name can be whatever you'd like, there will be a name change in the "name" property for the initial array. In the case of the first example here, "NOC - Master" - PARENT GROUP: you will need to identify the ID# of the group you wish to use as the source for the subgroup list and set the $parentGroupID to the appropriate ID# Purpose: Create an auto-updating high level NOC dashboard that can show - Rollup state for a list of client subgroups from our \Clients group - Group Indicators for a specific dataSource - Group indicators for a subset of devices within each group After the API region, there are three separate dashboards referenced to illustrate the 3 methods for using this dataSource. NOTE: my code uses backticks for line continuation. Where possible in my code, each line indicates a single piece of information about the script's algorithm and the first character in each line from a block indicates the line's relationship to the one above it. #> #region Rest API Initialization and Functions # Init variables used in the RESTApi functions $URLBase = "https://$company.logicmonitor.com/santaba/rest" $accessID = "##ApiAccessID.key##" $accessKey = "##ApiAccessKey.key##" #-------- The Functions ---------- function Send-Request { param ( $cred , $URL , $accessid = $null, $accesskey = $null, $data = $null, $version = '3' , $httpVerb = "GET" ) if ( $accessId -eq $null) { exit 1 } <# Use TLS 1.2 #> [Net.ServicePointManager]::SecurityProtocol = [Net.SecurityProtocolType]::Tls12 <# Get current time in milliseconds #> $epoch = [Math]::Round( ( New-TimeSpan ` -start (Get-Date -Date "1/1/1970") ` -end (Get-Date).ToUniversalTime()).TotalMilliseconds ) <# Concatenate Request Details #> $requestVars = $httpVerb + $epoch + $data + $resourcePath <# Construct Signature #> $hmac = New-Object System.Security.Cryptography.HMACSHA256 $hmac.Key = [Text.Encoding]::UTF8.GetBytes( $accessKey ) $signatureBytes = $hmac.ComputeHash( [Text.Encoding]::UTF8.GetBytes( $requestVars ) ) $signatureHex = [System.BitConverter]::ToString( $signatureBytes ) -replace '-' $signature = [System.Convert]::ToBase64String( [System.Text.Encoding]::UTF8.GetBytes( $signatureHex.ToLower() ) ) <# Construct Headers #> $auth = 'LMv1 ' + $accessId + ':' + $signature + ':' + $epoch $headers = New-Object "System.Collections.Generic.Dictionary[[String],[String]]" $headers.Add( "Authorization", $auth ) $headers.Add( "Content-Type" , 'application/json' ) # uses version 2 of the API $headers.Add( "X-version" , $version ) <# Make Request #> $response = Invoke-RestMethod ` -Uri $URL ` -Method $httpVerb ` -Body $data ` -Header $headers ` -erroraction SilentlyContinue ` -warningaction SilentlyContinue Return $response } function Get-LMRestAPIObjectListing { param ( $URLBase , $resourcePathRoot , # "/device/devices" $size = 1000 , $accessKey , $accessId , $version = '2' ) $output = @() $looping = $true $counter = 0 while ($looping) { #re-calc offset based on iteration $offset = $counter * $size $resourcePath = $resourcePathRoot $queryParam = "?size=$size&offset=$offset" $url = $URLBase + $resourcePath + $queryParam # Make Request $response = Send-Request ` -accesskey $accessKey ` -accessid $accessId ` -URL $url ` -version $version if ( $response.items.count -eq $size ) { # Return set is full, more items to retrieve $output += $response.items $counter++ } elseif ( $response.items.count -gt 0 ) { # Return set is not full, store date, end loop $output += $response.items $looping = $false } else { # Return set is empty, no data to store, end loop $looping = $false } } write-output $output } # Get Dashboards $resourcePath = "/dashboard/dashboards" $dashboards = Get-LMRestAPIObjectListing ` -resourcePathRoot $resourcePath ` -accessKey $accessKey ` -accessId $accessID ` -URLBase $URLBase # Get Widgets $resourcePath = "/dashboard/widgets" $widgets = Get-LMRestAPIObjectListing ` -resourcePathRoot $resourcePath ` -accessKey $accessKey ` -accessId $accessID ` -URLBase $URLBase # Get Groups $resourcePath = "/device/groups" $Groups = Get-LMRestAPIObjectListing ` -resourcePathRoot $resourcePath ` -accessKey $accessKey ` -accessId $accessID ` -URLBase $URLBase #endregion function generateJSON { param( $dashInfo, $clientnames, $deviceDisplayName = "*", $DSDisplayName = "*" ) $itemArray = @() foreach ($name in $clientnames) { $itemArray += @{ "type" = "device" "deviceGroupFullPath" = "Clients/$name" "deviceDisplayName" = $deviceDisplayName "dataSourceDisplayName" = $DSDisplayName "instanceName" = "*" "dataPointName" = "*" "groupBy" = "deviceGroup" "name" = "`#`#RESOURCEGROUP`#`#" } } # Write JSON back to the API for that widget $outputJSON = "`n`t{`n`t`t`"items`" : [`n" foreach ($item in $itemArray) { $elementJSON = @" { `"type`" : `"$($item.type)`", `"dataPointName`" : `"$($item.dataPointName)`", `"instanceName`" : `"$($item.instanceName)`", `"name`" : `"$($item.name)`", `"dataSourceDisplayName`" : `"$($item.dataSourceDisplayName)`", `"groupBy`" : `"$($item.groupBy)`", `"deviceGroupFullPath`" : `"$($item.deviceGroupFullPath)`", `"deviceDisplayName`" : `"$($item.deviceDisplayName)`" } "@ if ($item -ne $itemArray[-1]) { $outputJSON += "$elementJSON,`n" } else { # Last Item $outputJSON += "$elementJSON`n`t`t]`n`t}" } } write-output $outputJSON } # Get Client Names from groups $clientnames = ( $groups ` | where parentid -eq $parentGroupID ` | where name -notmatch "^\." ).name | sort #ID Master Dashboard # declare dashboard name and set default id and widgetid to use in the loop later $masterDash = @{ id=0; widgetid=0; name="NOC - Master" } $master = $dashboards | ? name -eq $masterDash.name if (($master.name).count -eq 1) { $masterDash.id = $master.id $masterDash.widgetid = $master.widgetsConfig[0].psobject.Properties.name $outputJSON = generateJSON ` -dashInfo $masterDash ` -clientnames $clientnames $resourcePath = "/dashboard/widgets/$($masterDash.widgetid)" $url = $URLBase + $resourcePath $widget = Send-Request ` -accessKey $accessKey ` -accessId $accessID ` -data $outputJSON ` -URL $URL ` -httpVerb "PATCH" } #ID Network Dashboard # declare dashboard name and set default id and widgetid to use in the loop later $networkDash = @{ id=0; widgetid=0; name="NOC - Network" } # preset filters for specific dashboard targeting by device $networkDeviceDisplayNameString = "*(meraki|kemp)*" $network = $dashboards | ? name -eq $networkDash.name if (($network.name).count -eq 1) { $networkDash.id = $network.id $networkDash.widgetid = $network.widgetsConfig[0].psobject.Properties.name $outputJSON = generateJSON ` -dashInfo $networkDash ` -clientnames $clientnames ` -deviceDisplayName $networkDeviceDisplayNameString $resourcePath = "/dashboard/widgets/$($networkDash.widgetid)" $url = $URLBase + $resourcePath $widget = Send-Request ` -accessKey $accessKey ` -accessId $accessID ` -data $outputJSON ` -URL $URL ` -httpVerb "PATCH" } #ID Security Dashboard # declare dashboard name and set default id and widgetid to use in the loop later $securityDash = @{ id=0; widgetid=0; name="NOC - Security" } # preset filters for specific dashboard targeting by datasource $securityDataSourceDisplayNameString = "Event Frequency Sec:4625 CTM" $security = $dashboards | ? name -eq $securityDash.name if (($security.name).count -eq 1) { $securityDash.id = $security.id $securityDash.widgetid = $security.widgetsConfig[0].psobject.Properties.name $outputJSON = generateJSON ` -dashInfo $securityDash ` -clientnames $clientnames ` -DSDisplayName $securityDataSourceDisplayNameString $resourcePath = "/dashboard/widgets/$($securityDash.widgetid)" $url = $URLBase + $resourcePath $widget = Send-Request ` -accessKey $accessKey ` -accessId $accessID ` -data $outputJSON ` -URL $URL ` -httpVerb "PATCH" }354Views3likes5CommentsDashboard Audit
Hello, Has anyone been auditing on Dashboard usage. We have a lot of dashboards and we want to know dashboard which weren't used for over 30 days. I do not see an API for this, is there another to get this info. Essentially we need find dashboard not being used for over 30 days then, we will mark them private for next 10 days and then remove them. Thanks, AshishSolved259Views6likes10Comments
Getting Graph Sharing Token via REST API
Hello, I am new member of LogicMonior. I have created new dashboard and done about adding device graph into dashboard via API, it work! but now, I want to generate “Widget Embedded URL” and also get “Sharing Token” via REST API, after created graph on Dashboard. Is it possible to do that? Thank you very much for all recommendation and commentSolved258Views24likes14Commentsdashboard display user timeout override
We have several ( hundreds of ) dashboards which show pertinent data to the relevant teams here. Each set of teams sit in separate areas, and they all need to see their dashboards. As such, we have set up dashboard stations ( computers with a bunch of screens attached ) so they can put all their dashboards in their own areas on a specific wall etc.. The only portal which is timing out is the LogicMonitor portal. Is there any way to override a specific account to not be bound by the portal settings for idle logons? We need to keep our. timeout settings as 4 hrs for all other users, but these specific screens need to remain forever not being logged out ( as much as is possible ) Is it possible to have a per-account override for “user session timeout” ?217Views7likes8CommentsFilter a Dashboard
Hello, I have a dashboard that I would like to clone and filter several times. The original has more than 500 rows so I would like to add a filter on one column content. a. is it possible at the dashboard level? b is it done through the datasource? Thanks, Dom201Views0likes1CommentCreating a propertySource to populate a NOC widget in a dashboard... need ## in a string.
The NOC widget items have a field that requires me to have the string "##RESOURCEGROUP##" pushed through the JSON into the NOC Item… since I’m using a propertySource to run the script on a schedule (I have a larger VM with a collector with a longer script timeout just for doing deeper scripted work through the API or Full Domain sweep types of things that will take more time), The LM System is going to try to replace that at run time rather than returning the explicit string. Who knows the correct escape sequence for turning that into a string literal on its way into the RestApi Patch? Scripting questions through support is best effort, and I don’t usually come with easy questions.Solved188Views11likes5Comments