Forum Discussion

asikarwar's avatar
4 months ago
Solved

Resource Property Filters on the New UI Preview

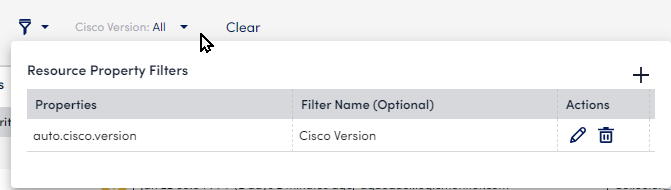
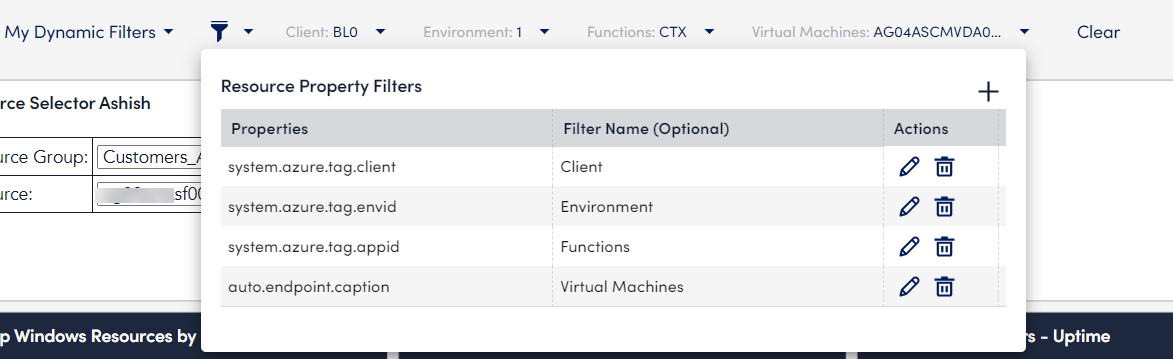
What exactly is “Resource Property Filters” in the new UI Preview, I tried and tested by creating two filters but I could not make them interdependent or linked to each other example based on what you selected from the first filter will populate set of values in the second filter and so on.


I do not see any option to make them interdependent so wondering what exactly is the use, and also are there any plans in to introduce filters in Dashboards?

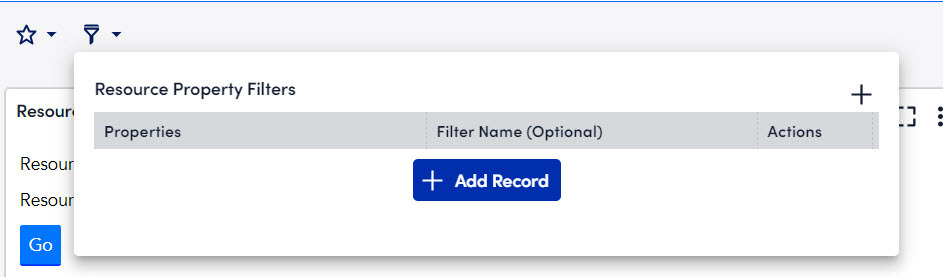
We can use the text widget to see if we can create custom filters but I want to know whether LM development is coming up with advance filters or not.

  • Also, i’m not sure why, but not all properties are available. I just tried adding a filter for the property we use as our tenant identifier. Not sure why it couldn’t find it because it’s guaranteed to be on every device. It is an inherited property so maybe that’s it?

    Hey @Stuart Weenig 

    That is correct, in the current iteration of the resource property filters, as well as the new resource explorer they do not work with inherited properties.  

    As to the specific situation you said wasn’t working.  If you have set up your tenant identifier to match that property in the Account Information → Portal Settings section of your portal.  You can use the property “system.tenant.identifier” to group your resources by tenant.  

    As far as other custom properties go, I know this is not a perfect solution, but there is always the option to make a very simple PropertySource to turn your custom inherited properties into auto.property making them usable in the filters.  The below code for example could be used to grab an inherited location property and turn it into an auto.property. 

    println("location=${hostProps.get('location')}")
     

10 Replies

  • It’s not what you think, or at least not what I would think.

    It allows you to setup a new filtering option based on a property. So if you wanted to filter the entire dashboard to only show devices where the cisco version was 17.6.5, you would first need the ability to filter by cisco version. Adding a record here creates a new dropdown that allows you to select the version you want included, at runtime. As far as i can tell, neither the filter itself nor the selections persist outside your account. The ability to use a defined filter persists across refreshes, but it’s definitely not part of the dashboard definition itself (export the dashboard to json to see for yourself). 

    This is a good step in the right direction, but not really usable since it has to be setup every time and was designed around a runtime execution process rather than part of the configuration of the dashboard that the admins can make to benefit the masses.

    One major thing it’s missing is the ability to filter by null values or filter for the absence of the property altogether. 

    1. Filters that persist or sticks and be able to filter by Resource Group followed by resource name or even filter lets say your data for example - show me CPU usage >=95 on the fly

    This is two different things. You can filter the entire dashboard by resource group and/or resource now. Use dashboard tokens.

    As far as filtering when a datapoint is above a certain threshold, that would be awesome. I know it’s been asked before. No idea if it’s on the roadmap.

    That dynamic-dashboards thing is the closest you get to it. There are drawbacks though like that it sets the filter for all users and it’s permanent until someone undoes it.

  • The simplest way to understand the way resource property filters work is to think of them working much like the role-based-access control does for devices. When you set up a dashboard, all the widgets have all their own filters which determine what data is going to be shown. (Those filters can be either hard-coded in the widget settings or, usually preferably, driven by dashboard tokens) What the end-user actually sees, however, is limited by the groups of resources (and websites) that they have view access to through the “users and roles” assignments associated with their portal user account. Aa a resuly, you and I might see the data from different subsets of resources on the same dashboard. For example, our top 10 CPU % graph on a custom graph widget might have different members because you can see some resources I can’t see, and vice-versa. 

    The resource property filters use the same kind of logic to change the data on a dashboard by limiting the view to a subset of resources that you can see;  they must both pass the RBAC check and that match the expression in the resource property filters. If you can see it, and it matches the property filters, then the data will then be put through the same filters as the widgets on the dashboard.

    The idea is that this gives a quick way to use resource properties to explore data without having to set up every possible resource group. For example, you might have a lot of AWS tags, too many to bother to set up dynamic groups for all of them, but sometimes want to see a view of just one of them on a particular dashboard. If you want them more to be more permanently attached to the dashboard, you can set up specific resource groups or include them directly in the widget filters. (Although I agree, it would be nice to have a way to get some commonly used ones quickly)

    It’s not designed to filter based on the time-series data contained in the datapoints (The top % options in the custom graph widgets can be useful for this kind of viewing), but I have seen users use a PropertySource to periodically evaluate a resource’s datapoint data and put their result in a device property, usually to allow for data-based dynamic grouping, but it could also work for this, so that might be worth exploring, depending on what you’re trying to do.

  • Also, i’m not sure why, but not all properties are available. I just tried adding a filter for the property we use as our tenant identifier. Not sure why it couldn’t find it because it’s guaranteed to be on every device. It is an inherited property so maybe that’s it?

    Hey @Stuart Weenig 

    That is correct, in the current iteration of the resource property filters, as well as the new resource explorer they do not work with inherited properties.  

    As to the specific situation you said wasn’t working.  If you have set up your tenant identifier to match that property in the Account Information → Portal Settings section of your portal.  You can use the property “system.tenant.identifier” to group your resources by tenant.  

    As far as other custom properties go, I know this is not a perfect solution, but there is always the option to make a very simple PropertySource to turn your custom inherited properties into auto.property making them usable in the filters.  The below code for example could be used to grab an inherited location property and turn it into an auto.property. 

    println("location=${hostProps.get('location')}")
     

  • As far as other custom properties go, I know this is not a perfect solution, but there is always the option to make a very simple PropertySource to turn your custom inherited properties into auto.property making them usable in the filters.  The below code for example could be used to grab an inherited location property and turn it into an auto.property. 

    println("location=${hostProps.get('location')}")

    For anyone thinking of doing this, be very careful. Inherited properties aren’t used for group membership for a reason. If you choose to make them device-level, you could end up with an inherited properties that cause a device-level property that causes it not to be in the group it inherited from, causing it to lose the inherited property then the device-level property. Without those, it’ll go back into the group where it will inherit and the process starts all over again. You could have devices constantly popping in and out of groups for no apparent reason.

    Ok, i get that LM is trying to do the agile thing and get an MVP out there then build on it. The problem is that LM’s track record is to get an MVP out there that is actually about 40% MVP. That wouldn’t be a problem for long if they continued adding to it and got it to MVP. However, they don’t. They squirrel away from features as soon as the first or second iteration are out there. They create tech debt for themselves that they’d rather just write off than dig themselves out of because that tech debt doesn’t satisfy the short-term-minded goals of the money grabbers that invested in LM (getting an MVP from 40% to 100% MVP doesn’t bring in money). 5:1 odds LM doesn’t get this properly built out in the next 3 years. Want me to make a list of the things that they’ve done this with in the past? No need, what did LM release in 2023?

  • Also, i’m not sure why, but not all properties are available. I just tried adding a filter for the property we use as our tenant identifier. Not sure why it couldn’t find it because it’s guaranteed to be on every device. It is an inherited property so maybe that’s it?

  • Thank you for Response Stuart!

    To be able to filter your dashboard is a very very useful thing.

    Number of use cases.

    1. Filters that persist or sticks and be able to filter by Resource Group followed by resource name or even filter lets say your data for example - show me CPU usage >=95 on the fly
    2. Can have multiple metrics with dynamic filters in the same dashboards etc.

    The only article I could find was this dynamic-dashboards by @Kevin Ford 

    I have worked with Grafana and used their Text panel similar to LMs text panel you can leverage JavaScript - html and make calls to Rest API.

    Do you think if Logic Monitor has any plans in their roadmap of 2024 on getting these dynamic filters in-built as one of the widgets/features

    Should we invest time into building custom filters using text panel?

    Thanks

    Ashish

  • I appreciate all the responses.

    I was able to get the properties in the filter in New UI Preview but I cannot link them so cannot use them at all.

    I was testing the following API with filter to see if I can get them populate in a dropdown.

    {{url}}/device/devices?sort=displayName&fields=displayName,systemProperties&filter=systemProperties.name:system.azure.tag.client,systemProperties.value:AG0,systemProperties.name:system.azure.tag.appid,systemProperties.value:SCM,systemProperties.name:System.displayname,systemProperties.value:US-E2:vm:ag04ascmvda001,systemProperties.name:system.azure.tag.func1,systemProperties.value:VD

    Based on what you select in the drop down will be then propagated to the widgets.

    As of now I do not need “Filter based on the time-series data contained in the datapoints”

    What I am really looking for is to include all properties based values in the dynamic filters (please remember I have more than 4000 customers) with this I can create only dashboard and select a specific Virtual Machines to display data for.

    This will help me greatly.

    In LM

    We already have a working example in Azure Workbooks

  • Yeah, it would appear that the definition of the filter itself (making it available to use) is not associated with the dashboard, so it’s part of your profile. It’s probably persistent even across logoff/logon. However, the selection you make in the filter once it’s created and available appears to be something associated with your session. It goes away pretty quickly.

  • As to the specific situation you said wasn’t working.  If you have set up your tenant identifier to match that property in the Account Information → Portal Settings section of your portal.  You can use the property “system.tenant.identifier” to group your resources by tenant.  

    Yes, i do. When i try to do this, it can’t find `system.tenant.identifier` in the dropdown searching for property. It’s ok, i don’t plan to move to UIv4 for dashboards until quite a few problems get resolved. I’ve got at least 9 months.