Question

Seeing Failed To Parse ServiceNow Integration


We are sometimes seeing “-2” as the ##EXTERNALTICKETID## when sending alerts to ServiceNow. When this happens and the alert clears it is not auto-closing the ticket in SNOW. Has anyone seen this or have any idea how to fix this. Seems when there is an event where multiple alerts generate and send to SNOW at once this happens.


12 replies

Userlevel 3
Badge +4

When you expand on one of the failures what is shown for the HTTP Response?

@Shack so it says failed but it does create the ticket in SNOW.

Active HTTP


Clear - HTTP response example with -2 in ticket id


Userlevel 4
Badge +1

We saw the the same thing recently.  It was during a period where there were lots of alerts being generated, as we had an issue on a storage platform that affected a lot of different things.

We were getting:

HTTP 500 - Delivery failed due to large volumes of failures to this URL.
HTTP 408 - Delivery failed due to timeout.

Of the ones that failed, I saw that “Delivery Retries” was either “None” or, at most, 1.

And all had “Failed to Parse” in the External Ticket ID.  The Incident was actually raised in Service Now, but LM did not know what the ticket ID was and so, when the alert cleared, it tried to update but with the same  “number”: “-2”   so I guess the integration can’t match it.

I assume this is really a Service Now performance issue rather than a Logic Monitor issue.  I’m not sure there’s much we can do to improve performance on the Service Now side as it’s a SaaS application (apologies, I’m not a Service Now person!)

Is there anything that Logic Monitor could do to improve the situation?  Perhaps slow down the rate it makes calls to the Service Now API if it starts to get HTTP 500 and 408 responses?  Perhaps also increase the number of retries?

I’ve had a look at the Rate Limit functionality in LM.  I was hoping this would allow LM to queue up alerts and deliver them at a slower rate if an integration can’t handle the flow.  I think it actually throws away alerts when the rate is too high.

Dave


Yes I had the same idea with rate limit but we would never want a slew of alerts come in and then some make it to the team and some get thrown away so that was a definite no go. 
 

I am curious if any other monitoring tools that integrate with SNOW have the same issue hitting the API and not getting a ticket id like we saw in logic monitor? 

Userlevel 7
Badge +18

If you’re talking about the alert rate limit on the escalation chain, it does queue them up. That’s been my experience at least. We’ve had a few cases where I’ve pushed bad code causing several thousand alerts. They all go to email, but I suppose the rate limit should behave the same. Let’s say your limit is 200 alerts / 10 minutes and you have 1000 alerts.

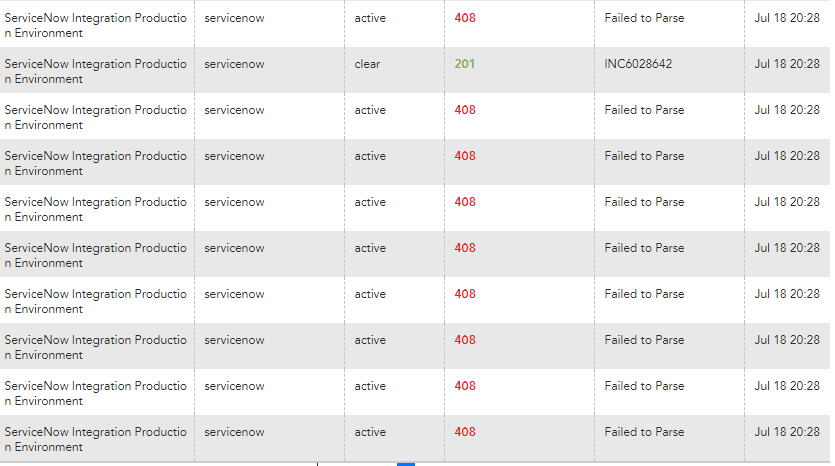
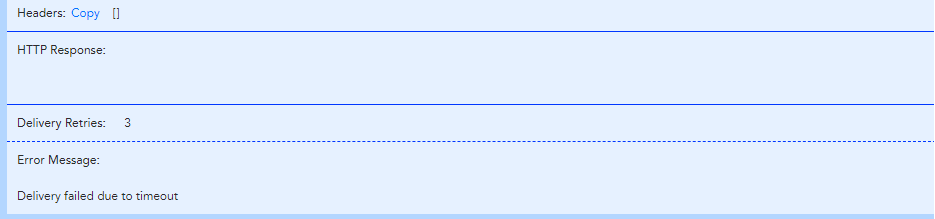
First you get 200 notifications. You immediately get a “escalation chain throttled” notification. This isn’t an alert, but is treated like one by the escalation chain, has an alert id and everything. I would assume you’d get the same thing in an API push to any ticketing system, but I have no idea what the payload would look like, not having seen that happen with my ticketing system yet.

Then when 10 minutes goes by, you get the next 200 notifications plus a “throttled” notification.

Then when 10 minutes goes by, you get the next 200 notifications plus a “throttled” notification.

Keep in mind that you could have other alerts opening during this time. Eventually you get to a point where the last queued alerts are sent, but you may get into a cycle where the last 10 minutes had 198 alerts and 2 minutes later you get another 10 alerts. In that case, 2 more alerts would be sent immediately (plus a throttle notification) and after a while you’d get the other 8. 

That’s been my experience. YMMV. I’ve seen it in email notifications, but that’s where my alert storms happen.

Userlevel 4
Badge +1

Ah ok, that’s interesting, maybe that will do what we need then.  It would be helpful if we could avoid getting a bunch of throttled notifications as I expect those will get tickets opened for them as well.  I have a ticket open with our internal Service Now team (to see if we can get to the bottom of the performance issue) and with Logic Monitor support (to see if there’s anything we can do from the LM side to help).

Dave

Userlevel 4
Badge +1

We’ve had another instance of this happening, again, it was when we had an issue that affected many monitored hosts so had quite a few alerts generate simultaneously.

I spoke with one of LM’s Customer Technical Architects about it the other day and the suggestion was that we may have caused Service Now to process the messages too slowly by introducing some post-processing or scripting into the field mappings done on the Service Now.  We’re working with our Service Now team at the moment to understand what we an do to improve it.

@mandy1193 I’d be interested to know how many alerts your LM system pushed through to Service Now when you saw this issue?  Do you have much in the way of customisation on the Service Now side of your integration configuration?  


Dave


Userlevel 4
Badge +1

An update on our situation for anyone who finds this thread later on….

We put together a tool that we could use to manually make a load of requests to the Logic Monitor integration on our test instance of Service Now.  So we can reliably recreate the issue.

The issue is essentially in the processing time on our Service Now instance.  As long as the client (e.g. Logic Monitor - or in our case, our testing script) waits long enough, then everything processes fine. 

Service Now is not throwing 408 or 500 errors at all.  That’s a bit of a red herring.

It seems that Logic Monitor has a timeout of perhaps 30 minutes on calls to integrations.  I suspect this is handled by a separate process/microservice in Logic Monitor, and that passes 408 or 500 errors back to the alerting handling part of Logic Monitor when an integration call fails (or times out in our case).

One aspect I think may be an LM bug is it storing “-2” for ExternalTicketId when it’s not received anything back at all.

We’re focusing our efforts on figuring out if we can improve the performance on Service Now.  As a workaround, Logic Monitor support have increased the timeout on integration calls to 120 seconds on our instance.

Dave


Userlevel 5
Badge +10

Another annoyance here is not being able to easily alert on this. I would love to be able to webhook out to our chat client when failures happen. Instead I have to manually go and check every few days to make sure things are flowing properly.

Userlevel 4
Badge +1

@Joe Williams Yep, that’s exactly what we’re looking to solve at the moment.  I’m hoping that maybe it’s something that we can pick up through the API.  Then perhaps we can run an automatic check a few times a day.

Is this something that you’re seeing frequently as well?

Dave

Userlevel 5
Badge +10

@Dave Lee You can get it through the API I had a thing going at one time or another. It was part of the unpublished api. You had/have to get the calls via web developer tools. My issue was some of the ordering didn’t work so I had to chunk through 100s of entries before I got to the newest.

Userlevel 3
Badge +4

Another annoyance here is not being able to easily alert on this. I would love to be able to webhook out to our chat client when failures happen. Instead I have to manually go and check every few days to make sure things are flowing properly.

I tried setting up a web check for the inbound web service in Service Now but the http response was just too much information for it to be useful.  My thought was to watch for errors on the inbound web service and alert on timeouts etc.

Reply