DanB Advisor
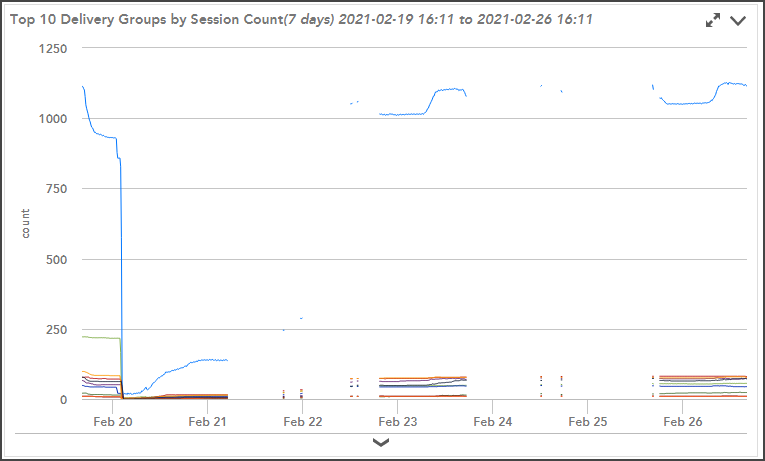
AdvisorAdvisorHello, I'm looking at tweaking my collectors b/c I see these collection services are maxed out.
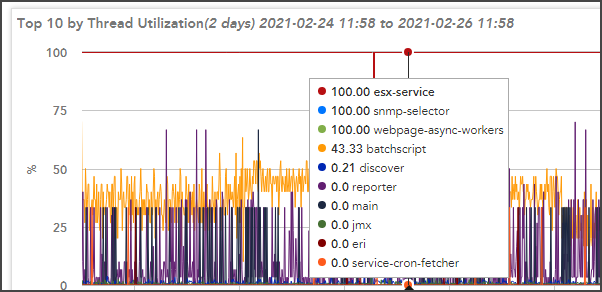
What settings in the collector config can I bump up to improve these collection services? I searched for these specific sections but some don't find any specific to these exactly.
 Employee
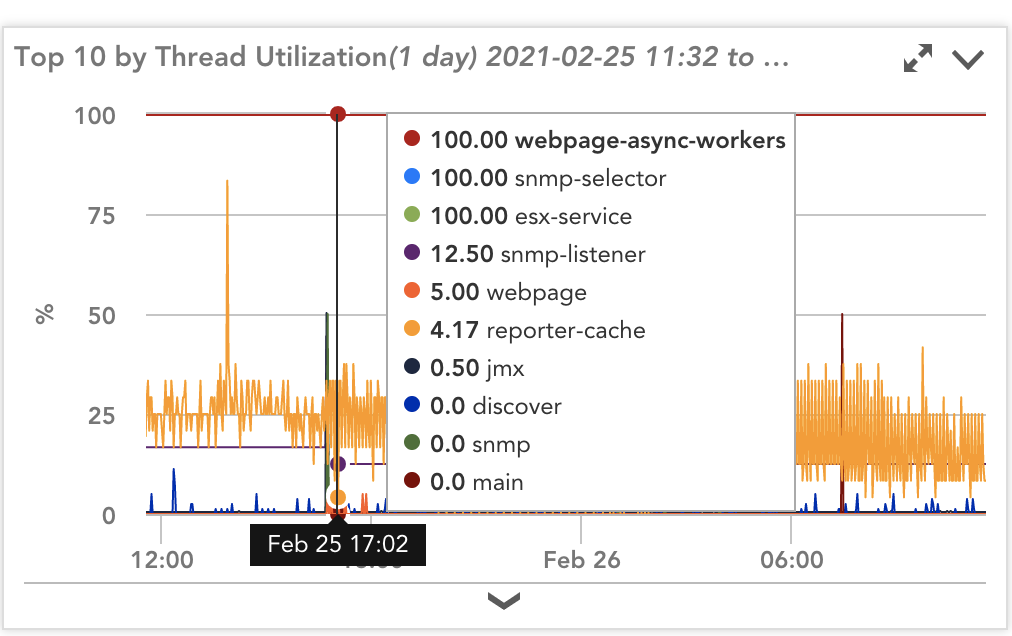
This is from a lab collector that is monitoring a handful of devices, so what you're seeing might be totally normal. I think those are single threads having to do with the collector's internal task management (but I am not certain of this, and will be interested to hear what the support team has to say)
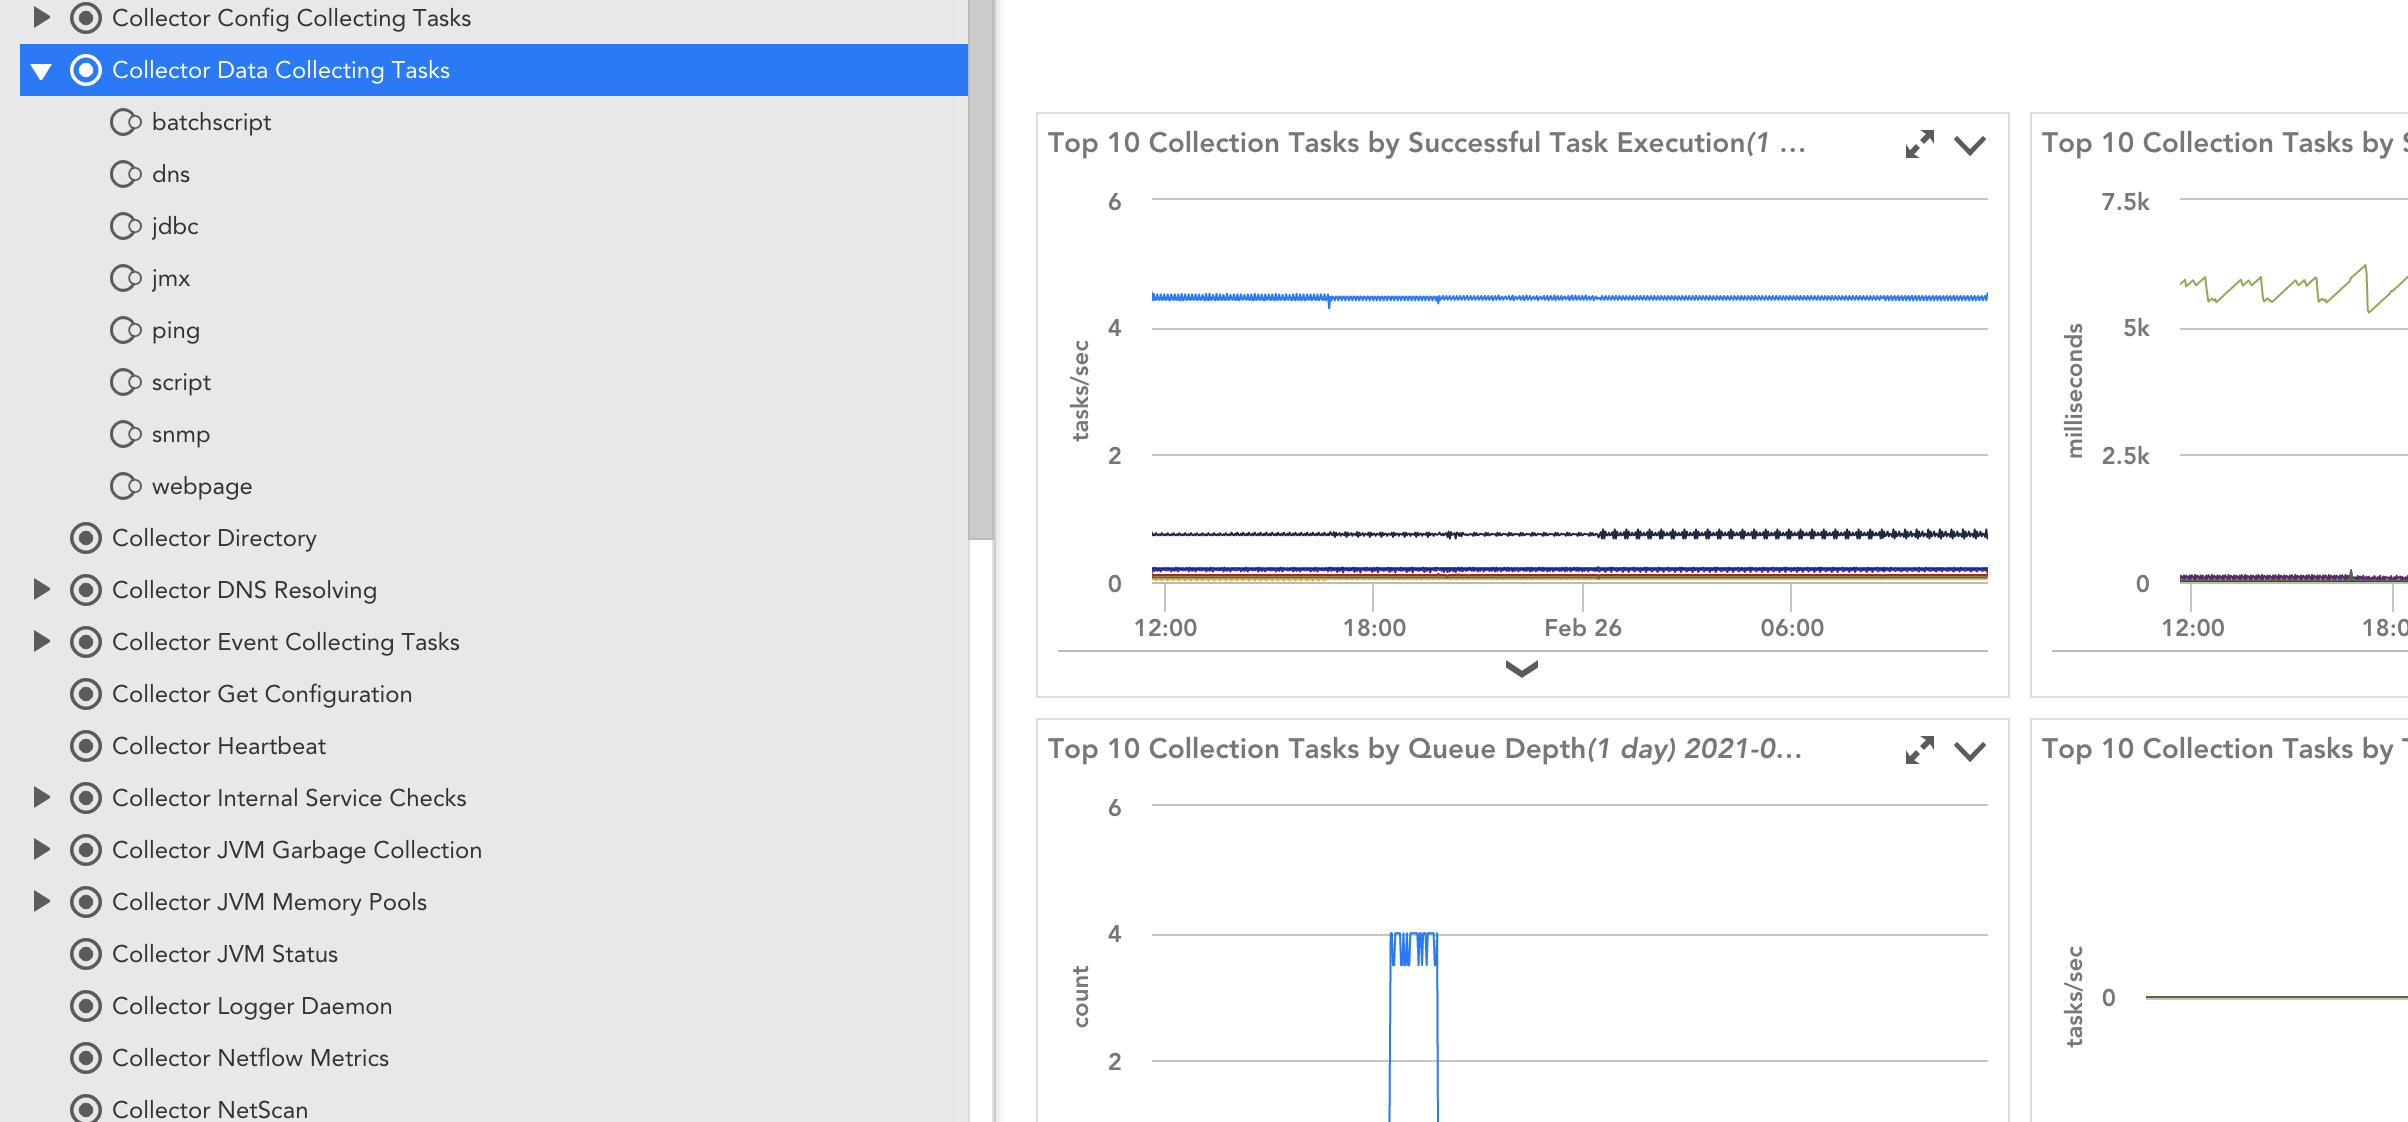
This datasource has the counters for the collection tasks. Probably the most important one of these having to do with thread availability is the unavailable thread counter (visible on the instances)
I'd ask support. Once you find out the answer, please post it back here.
AdvisorHey Stu!!! I already have a case open asking but figured I'd post in here if anyone else knew. Searching didn't' find anything either so asked.
Once I get a response I'll update.
AdvisorHi Mike. Thanks for the info. I'm not sure if that specific collector Datapoint is displaying that graph correctly b/c I know we had like 100's of failed tasks for the XenApp_* datasources that spawned my support issues in the 1st place. This was based on BatchScripts.
The graph is showing only .0046t/s : "# of tasks /second that are being scheduled that are still waiting for a thread from a previously scheduled task."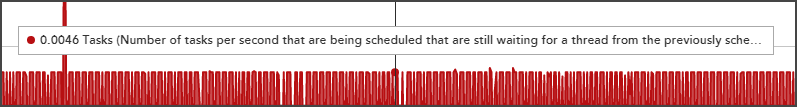
Unavailable Thread Scheduling:
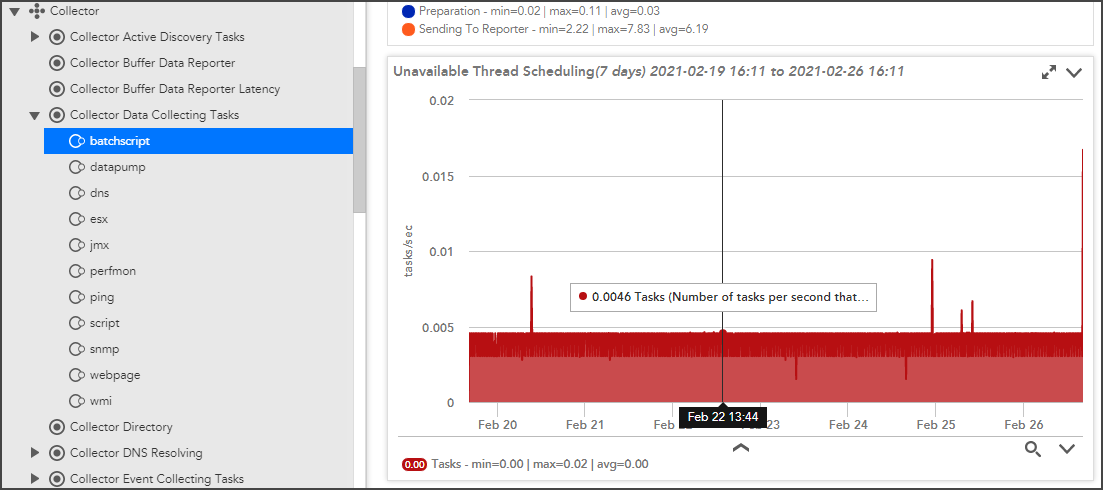
I looked into this b/c was getting huge gaps in this DS's DataPoints. Once we bumped up the batchscript thread count it started working so far nicely. We'll see over the weekend how it holds up.