Forum Discussion
DanB Advisor
5 years ago Advisor
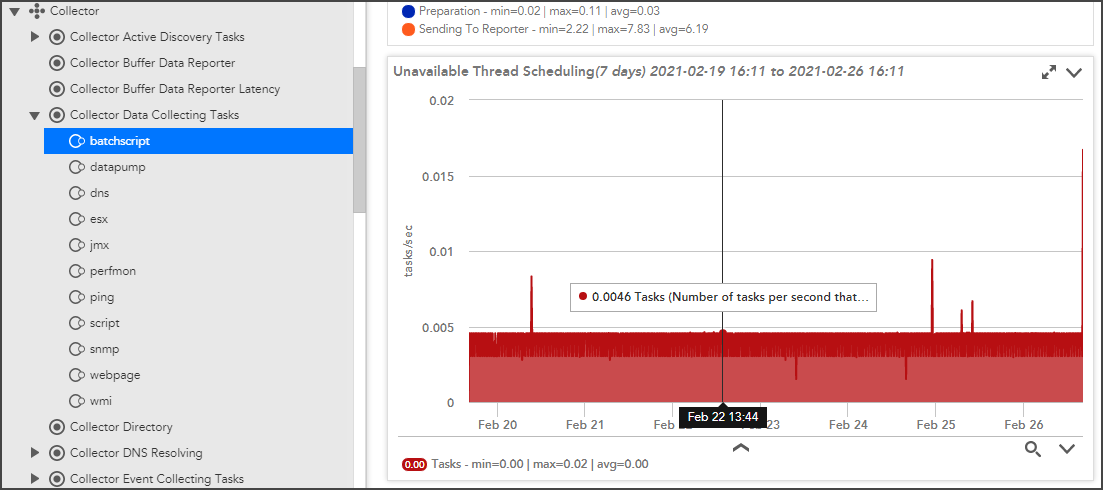
Hi Mike. Thanks for the info. I'm not sure if that specific collector Datapoint is displaying that graph correctly b/c I know we had like 100's of failed tasks for the XenApp_* datasources that spawned my support issues in the 1st place. This was based on BatchScripts.
The graph is showing only .0046t/s : "# of tasks /second that are being scheduled that are still waiting for a thread from a previously scheduled task."
Unavailable Thread Scheduling:

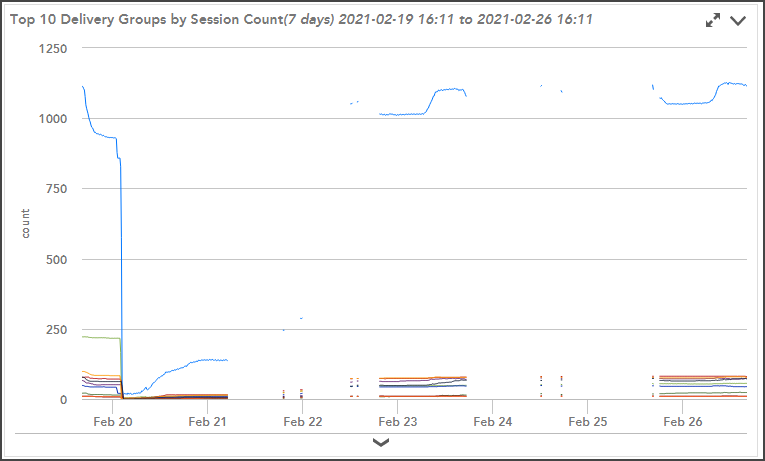
I looked into this b/c was getting huge gaps in this DS's DataPoints. Once we bumped up the batchscript thread count it started working so far nicely. We'll see over the weekend how it holds up.
