Forum Discussion
Mike_Aracic Employee
5 years ago Employee
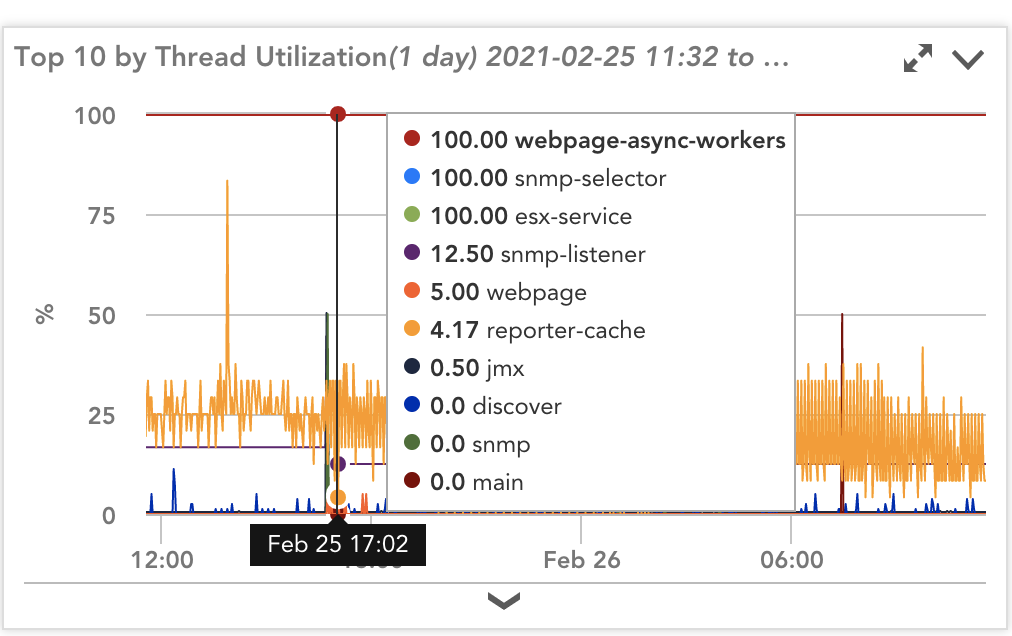
This is from a lab collector that is monitoring a handful of devices, so what you're seeing might be totally normal. I think those are single threads having to do with the collector's internal task management (but I am not certain of this, and will be interested to hear what the support team has to say)

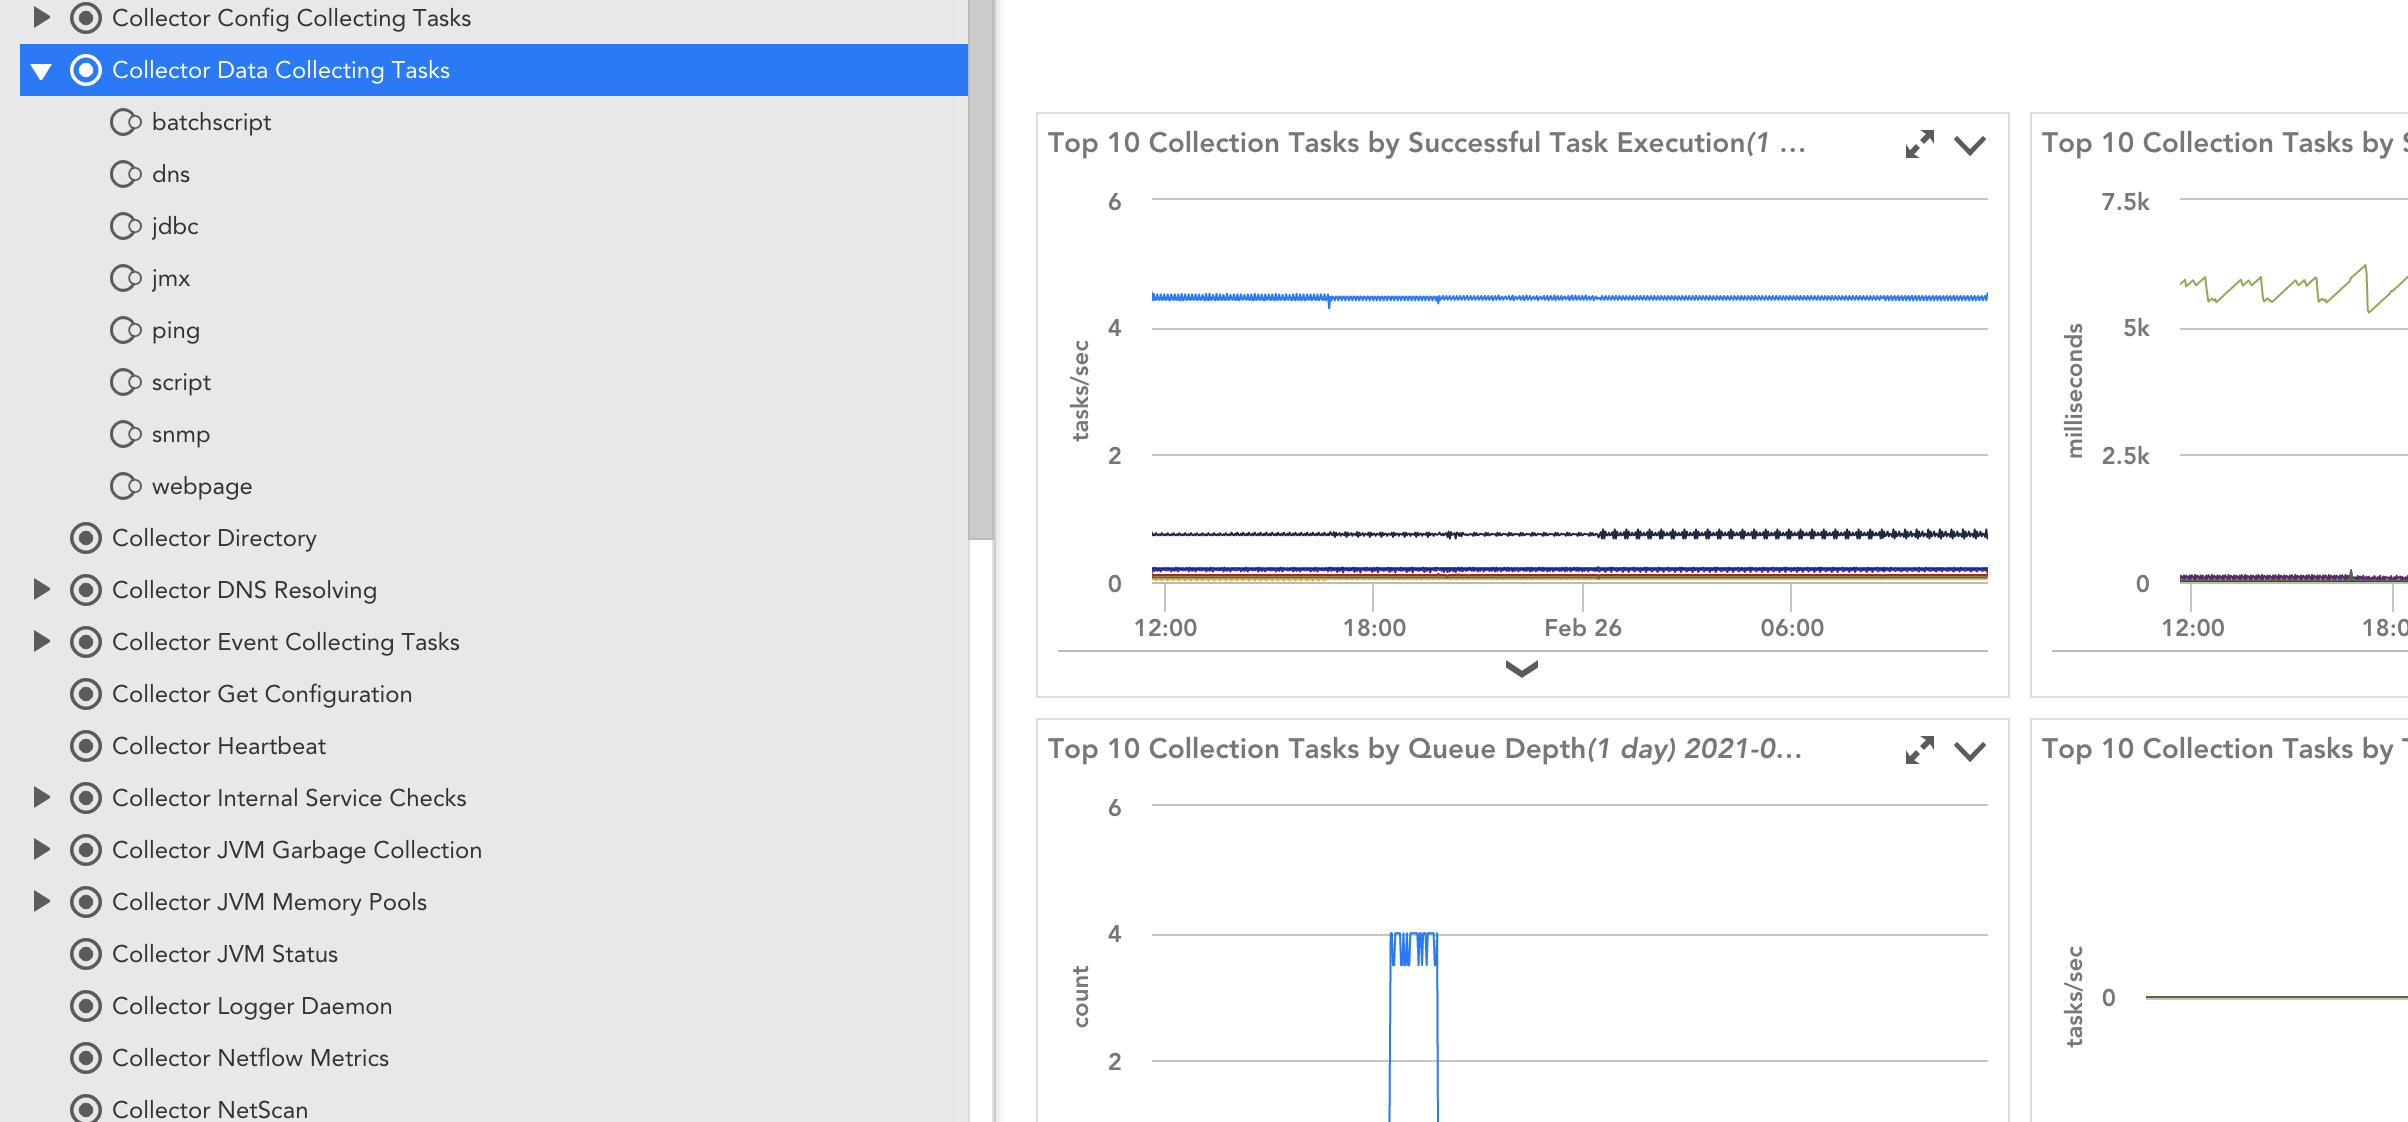
This datasource has the counters for the collection tasks. Probably the most important one of these having to do with thread availability is the unavailable thread counter (visible on the instances)

