Forum Discussion

mkerfoot's avatar
5 years ago

COVID-19

Hey all,

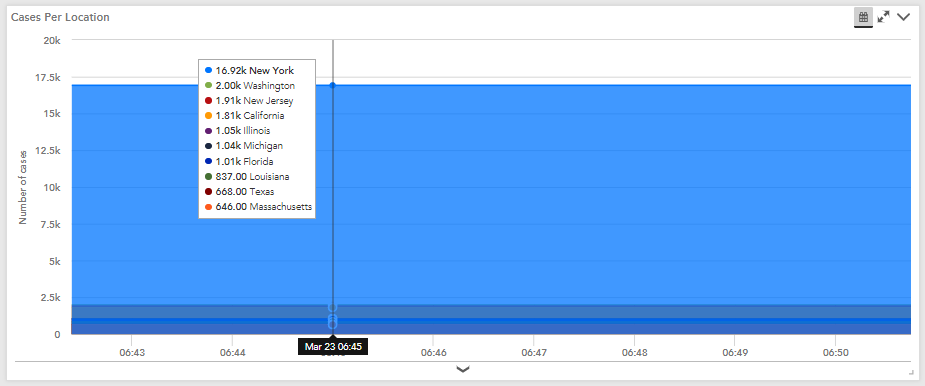
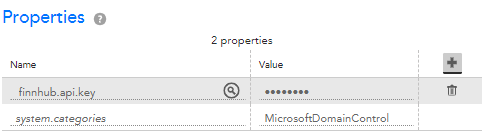
I built out a datasource to monitor the COVID-19 cases and deaths per state. An API key from Finnhub.io is required to run this DataSource. The API key must be saved as a custom property on the device you want this DataSource applied to. The Custom Propery name needs to be "finhubb.api.key" with the value being the Finnhub.io API key. Finnhub.io offers a free API key teir that allows 60 queries a minute.

Locator Code: M9WGM3

10 Replies

  • XML;

    <?xml version="1.0" encoding="UTF-8" ?>
    <feed  version="1.0" hasPendingRequests="false" >
      <company></company>
      <status>200</status>
      <errmsg>OK</errmsg>
      <interval>0</interval>
        <entry type="predatasource">
            <version>1584963910</version>
            <name>Finnhub.io_COVID_19-</name>
            <displayedas>COVID 19</displayedas>
            <description>Gathers statistics about COVID-19</description>
            <collector>script</collector>
            <hasMultiInstances>true</hasMultiInstances>
            <schedule>60</schedule>
            <appliesTo>finnhub.api.key</appliesTo>
            <wildcardauto>true</wildcardauto>
            <wildcardpersist>true</wildcardpersist>
            <wildcardlinuxscript>ad_script</wildcardlinuxscript>
            <wildcardlinuxcmdline>type=&#34;powerShell&#34; </wildcardlinuxcmdline>
            <wildcardwinscript>ad_script</wildcardwinscript>
            <wildcardwincmdline>type=&#34;powerShell&#34; </wildcardwincmdline>
            <wildcardgroovyscript># API key from finnhub.io.
    $Key = &#34;##finnhub.api.key##&#34;
    
    $Uri = &#34;https://finnhub.io/api/v1/covid19/us?token=$Key&#34;
    $Data = Invoke-WebRequest -Uri $Uri -Method Get -UseBasicParsing | Select-Object -ExpandProperty Content | ConvertFrom-Json
    
    
    # Loop through each location and get the location names.
    foreach ($instance in $Data) {
         $Location = $instance.State
         Write-Host &#34;$Location##$Location&#34;
    }
    
    # Exit PowerShell Script to ensure now active sessions are left open.
    Exit 0;</wildcardgroovyscript>
            <wildcardschedule>0</wildcardschedule>
            <wildcarddisable>false</wildcarddisable>
            <wildcarddeleteinactive>true</wildcarddeleteinactive>
            <agdmethod>none</agdmethod>
            <agdparams></agdparams>
            <group></group>
            <tags></tags>
            <technology>Created by Matt Kerfoot
    
    Must have an API key for Finnhub.io. The API key must be saved as a new custom property under the device you want to run this datasource on called, &#34;finnhub.api.key&#34; with the value being the API Key.</technology>
            <adlist><![CDATA[{"agdmethod":"none","method":"ad_script","agdparams":"","id":0,"filters":[],"params":{"type":"powerShell","groovyscript":"# API key from finnhub.io.\r\n$Key = \"##finnhub.api.key##\"\r\n\r\n$Uri = \"https://finnhub.io/api/v1/covid19/us?token=$Key\"\r\n$Data = Invoke-WebRequest -Uri $Uri -Method Get -UseBasicParsing | Select-Object -ExpandProperty Content | ConvertFrom-Json\r\n\r\n\r\n# Loop through each location and get the location names.\r\nforeach ($instance in $Data) {\r\n     $Location = $instance.State\r\n     Write-Host \"$Location##$Location\"\r\n}\r\n\r\n# Exit PowerShell Script to ensure now active sessions are left open.\r\nExit 0;"}}]]></adlist>
            <schemaVersion>2</schemaVersion>
            <dataSourceType>1</dataSourceType>
            <attributes>
            <attribute>
                <name>scripttype</name>
                <value>powerShell</value>
                <comment></comment>
            </attribute>
            <attribute>
                <name>scriptgroovy</name>
                <value># Required ASI Key from finnhub.io.
    $Key = &#34;##finnhub.api.key##&#34;
    
    # Wildvalue will such in each Location from the Active Discovery Script.
    $wildvalue = &#34;##WILDVALUE##&#34;
    
    # Retrieve Covid 19 data per each location.
    $Data = Invoke-WebRequest -Method Get -Uri &#34;https://finnhub.io/api/v1/covid19/us?token=$Key&#34; -UseBasicParsing | Select-Object -ExpandProperty Content | ConvertFrom-Json
        
        # Puts Case and Death counts in variables to be written to LogicMonitor.
        $Case = ($Data | Where-Object State -eq $wildvalue).case
        $Death = ($Data | Where-Object State -eq $wildvalue).death
        
             # Writes the Case and Death counts to LogicMonitor.
             Write-Host Cases=$Case
             Write-Host Deaths=$Death
    
    # Exit PowerShell Script to ensure now active sessions are left open.
    Exit 0;</value>
                <comment></comment>
            </attribute>
            <attribute>
                <name>windowsscript</name>
                <value></value>
                <comment></comment>
            </attribute>
            <attribute>
                <name>linuxscript</name>
                <value></value>
                <comment></comment>
            </attribute>
            <attribute>
                <name>windowscmdline</name>
                <value></value>
                <comment></comment>
            </attribute>
            <attribute>
                <name>linuxcmdline</name>
                <value></value>
                <comment></comment>
            </attribute>
            </attributes>
            <datapoints>
            <datapoint>
                <name>Deaths</name>
                <dataType>7</dataType>
                <type>2</type>
                <postprocessormethod>namevalue</postprocessormethod>
                <postprocessorparam>Deaths</postprocessorparam>
                <usevalue>output</usevalue>
                <alertexpr></alertexpr>
                <alertmissing>1</alertmissing>
                <alertsubject></alertsubject>
                <alertbody></alertbody>
                <enableanomalyalertsuppression></enableanomalyalertsuppression>
                <description>Number of Deaths</description>
                <maxvalue></maxvalue>
                <minvalue></minvalue>
                <userparam1></userparam1>
                <userparam2></userparam2>
                <userparam3></userparam3>
                <iscomposite>false</iscomposite>
                <rpn></rpn>
                <alertTransitionIval>0</alertTransitionIval>
                <alertClearTransitionIval>0</alertClearTransitionIval>
            </datapoint>
            <datapoint>
                <name>Cases</name>
                <dataType>7</dataType>
                <type>2</type>
                <postprocessormethod>namevalue</postprocessormethod>
                <postprocessorparam>Cases</postprocessorparam>
                <usevalue>output</usevalue>
                <alertexpr></alertexpr>
                <alertmissing>1</alertmissing>
                <alertsubject></alertsubject>
                <alertbody></alertbody>
                <enableanomalyalertsuppression></enableanomalyalertsuppression>
                <description>Number of Covid 19 cases</description>
                <maxvalue></maxvalue>
                <minvalue></minvalue>
                <userparam1></userparam1>
                <userparam2></userparam2>
                <userparam3></userparam3>
                <iscomposite>false</iscomposite>
                <rpn></rpn>
                <alertTransitionIval>0</alertTransitionIval>
                <alertClearTransitionIval>0</alertClearTransitionIval>
            </datapoint>
            </datapoints>
            <graphs>
            <graph>
                <name>Cases</name>
                <title>Cases</title>
                <verticallabel>Number of Cases</verticallabel>
                <rigid>false</rigid>
                <maxvalue>NaN</maxvalue>
                <minvalue>0.0</minvalue>
                <displayprio>1</displayprio>
                <timescale>1day</timescale>
                <base1024>false</base1024>
                <graphdatapoints>
            <graphdatapoint>
                <name>Cases</name>
                <datapointname>Cases</datapointname>
                <cf>1</cf>
            </graphdatapoint>
                </graphdatapoints>
                <graphvirtualdatapoints>
                </graphvirtualdatapoints>
                <graphdatas>
                <graphdata>
                    <type>2</type>
                    <legend>Cases</legend>
                    <color>silver</color>
                    <datapointname>Cases</datapointname>
                    <isvirtualdatapoint>false</isvirtualdatapoint>
                </graphdata>
                </graphdatas>
            </graph>
            <graph>
                <name>Deaths</name>
                <title>Deaths</title>
                <verticallabel>Number of Deaths</verticallabel>
                <rigid>false</rigid>
                <maxvalue>NaN</maxvalue>
                <minvalue>0.0</minvalue>
                <displayprio>2</displayprio>
                <timescale>1day</timescale>
                <base1024>false</base1024>
                <graphdatapoints>
            <graphdatapoint>
                <name>Deaths</name>
                <datapointname>Deaths</datapointname>
                <cf>1</cf>
            </graphdatapoint>
                </graphdatapoints>
                <graphvirtualdatapoints>
                </graphvirtualdatapoints>
                <graphdatas>
                <graphdata>
                    <type>1</type>
                    <legend>Deaths</legend>
                    <color>red</color>
                    <datapointname>Deaths</datapointname>
                    <isvirtualdatapoint>false</isvirtualdatapoint>
                </graphdata>
                </graphdatas>
            </graph>
            </graphs>
            <overviewgraphs>
            <overviewgraph>
                <name>Cases Per Location</name>
                <title>Cases Per Location</title>
                <verticallabel>Number of cases</verticallabel>
                <rigid>false</rigid>
                <maxvalue>NaN</maxvalue>
                <minvalue>0.0</minvalue>
                <displayprio>1</displayprio>
                <timescale>1day</timescale>
                <base1024>false</base1024>
                <aggregated>false</aggregated>
                <datapoints>
            <overviewgraphdatapoint>
                <name>Cases</name>
                <datapointname>Cases</datapointname>
                <cf>1</cf>
                <aggregateMethod>average</aggregateMethod>
            </overviewgraphdatapoint>
                </datapoints>
                <virtualdatapoints>
                </virtualdatapoints>
                <lines>
                <overviewgraphline>
                    <type>2</type>
                    <legend>##INSTANCE##</legend>
                    <datapointname>Cases</datapointname>
                    <isvirtualdatapoint>false</isvirtualdatapoint>
                    <color>silver</color>
                </overviewgraphline>
                </lines>
            </overviewgraph>
            <overviewgraph>
                <name>Deaths Per Location</name>
                <title>Deaths Per Location</title>
                <verticallabel>Number of Deaths</verticallabel>
                <rigid>false</rigid>
                <maxvalue>NaN</maxvalue>
                <minvalue>0.0</minvalue>
                <displayprio>1</displayprio>
                <timescale>1day</timescale>
                <base1024>false</base1024>
                <aggregated>false</aggregated>
                <datapoints>
            <overviewgraphdatapoint>
                <name>Deaths</name>
                <datapointname>Deaths</datapointname>
                <cf>1</cf>
                <aggregateMethod>average</aggregateMethod>
            </overviewgraphdatapoint>
                </datapoints>
                <virtualdatapoints>
                </virtualdatapoints>
                <lines>
                <overviewgraphline>
                    <type>2</type>
                    <legend>##INSTANCE##</legend>
                    <datapointname>Deaths</datapointname>
                    <isvirtualdatapoint>false</isvirtualdatapoint>
                    <color>silver</color>
                </overviewgraphline>
                </lines>
            </overviewgraph>
            </overviewgraphs>
            <scripts>
            </scripts>
        </entry>
    </feed>


  • Anonymous's avatar
    Anonymous

    Took me a minute to notice that this requires a Windows collector since it's powershell.  With your permission, I may rewrite the scripts to groovy so they can run on either Windows or Linux.

  • 9 minutes ago, Stuart Weenig said:

    Took me a minute to notice that this requires a Windows collector since it's powershell.  With your permission, I may rewrite the scripts to groovy so they can run on either Windows or Linux.

    Have at it, @Stuart Weenig!

  • Anonymous's avatar
    Anonymous

    Also, I added some graphs. Also, I just committed a new version that groups by country.

  • Anonymous's avatar
    Anonymous

    Just had a realization. If you aren't interested in all states, you could apply a discovery filter to only include those states where your company has offices. 

  • 1 minute ago, Stuart Weenig said:

    Just had a realization. If you aren't interested in all states, you could apply a discovery filter to only include those states where your company has offices. 

    That is a good point. I found a little bug too. the API is returning "Colorado " with a space at the end which was returning NaN in the script. I did a ghetto little workaround.

    Its not pretty but it works. lol

     if($wildvalue -eq "Colorado"){
        $Case = ($Data | Where-Object State -eq "Colorado ").case
        $Death = ($Data | Where-Object State -eq "Colorado ").death
        
             Write-Host Cases=$Case
             Write-Host Deaths=$Death
                   }else{
         
    $Data = $Return | Select-Object -ExpandProperty Content | ConvertFrom-Json
        
        $Case = ($Data | Where-Object State -eq $wildvalue).case
        $Death = ($Data | Where-Object State -eq $wildvalue).death
        
             Write-Host Cases=$Case
             Write-Host Deaths=$Death
                   }
     

  • Anonymous's avatar
    Anonymous

    Yeah, the groovy version had that problem too. I didn't notice the trailing space, but I did notice a record with a name of " " and one that had a leading space. If you look at the groovy code, you'll see a .trim() method that eliminates that.

  • 3 minutes ago, Stuart Weenig said:

    FYI, i've started a github repo with my personal datasources, including the groovy version of this one: https://github.com/sweenig/lmcommunity. Feel free to grab anything from there.

    My hero! Thanks again for all the hard work!