Watching Over Tunnels
--- "To him who is able to keep you from stumbling" ----
Monitoring a tunnel to be notified if it is stumbling is what this topic is all about.
Last year there was a request by one of our financial customer, a private investment bank, that uses Palo Alto Networks firewall to monitor the VPN tunnels on PAN device and although there are wide range of monitoring set with our current LogicModules, this specific feature is yet to be developed, so here comes a customized monitoring, leveraging on existing datasources. I will, again, refrain mentioning customer's name as I have no permission to use, but initial would suffice ("MB").
I had a privilege to deploy PAN device (PA-5000 series) long before layer-7 firewall becomes popular, when PAN stole the head-start in the industry. It is dubbed to be one of the sophisticated firewalls in the market even until now with its heartbreaking price (in my opinion) but it delivers its promise though. They even have virtual appliance which is quite efficient and a real software-driven firewall although selling the box is definitely a more money-making business just short years ago while nowadays hardware business with high-cost brand or trademark may start losing grounds and thanks to software-driven 'everything' (network,storage,data centre,etc).
Nothing fancy about it but it was meticulously established based on a research of Palo Alto Networks API. It is not official datasource in LogicMonitor repository yet but it is in LMExchange community grade datasource (you can download with LogicModule Locator: 2KLFET).
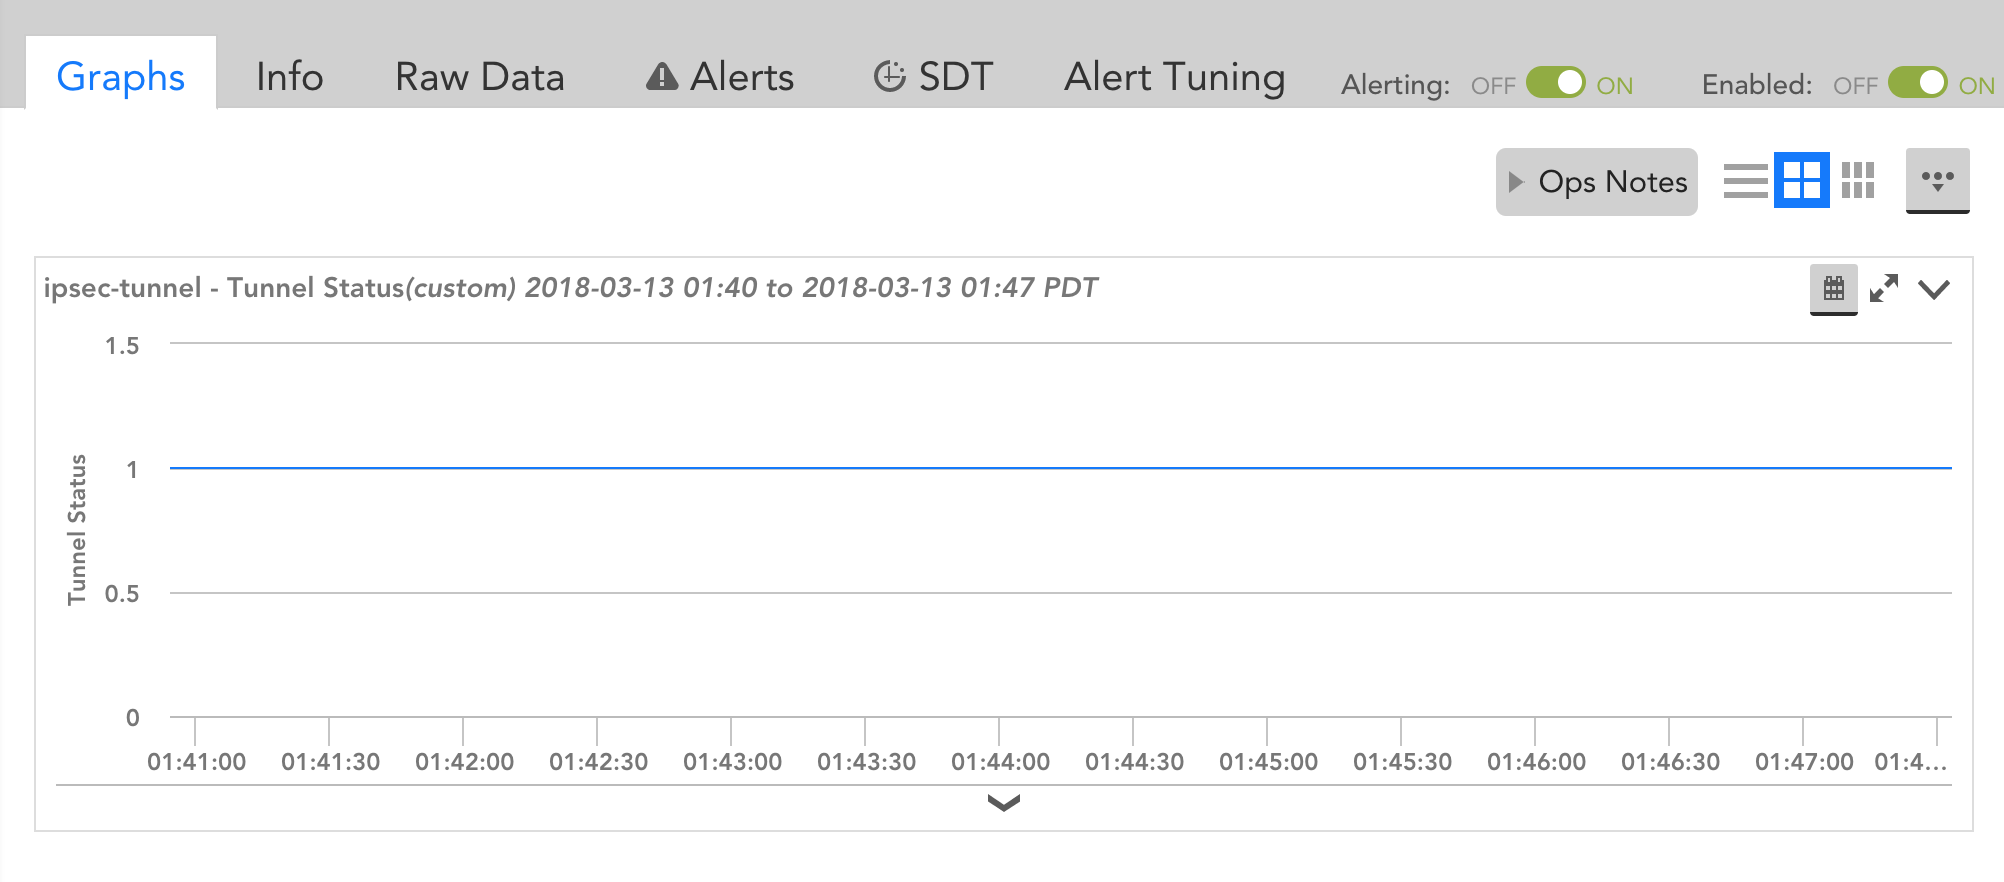
Here is a working sample applied on a PA-800 series device with 3 tunnels connected to remote PAN devices:

Following is the Active Discovery script to discover the active tunnels on the device :
import com.santaba.agent.groovyapi.http.*;
apikey = hostProps.get("paloalto.apikey.pass")
host = hostProps.get("system.hostname")
command = java.net.URLEncoder.encode("<show><running><tunnel><flow><all></all></flow></tunnel></running></show>");
url = "https://${host}/api/?type=op&key=${apikey}&cmd=${command}";
response_xml = HTTP.body(url);
response_obj = new XmlSlurper().parseText(response_xml);
response_obj.result.IPSec.entry.each()
{
  name = it.name.text()
  tunnelid = it.id.text();
  innerIf = it."inner-if".text();
  localip = it."localip".text();
  peerip = it."peerip".text();
    println "${tunnelid}##${name}##local:${localip} - peer:${peerip}";

}
  return 0;
and afterward Collection script to get the data needed:
import com.santaba.agent.groovyapi.http.*;
apikey = hostProps.get("paloalto.apikey.pass")
host = hostProps.get("system.hostname")
wildvalue = '##WILDVALUE##';
command = java.net.URLEncoder.encode("<show><running><tunnel><flow><tunnel-id>" + wildvalue + "</tunnel-id></flow></tunnel></running></show>")
url = "https://${host}/api/?type=op&key=${apikey}&cmd=${command}"
response_xml = HTTP.body(url);
response_obj = new XmlSlurper().parseText(response_xml);
response_obj.result.IPSec.entry.each()
{
    entry ->
   entry.children().each()
    {
        node ->
        println node.name() + ": " + node.text();
        node.children().each()
        {
            list ->
            println list.name() + ": " + list.text();
            list.children().each()
            {
                instance ->
                    println instance.name() + ":" + instance.text();
            }
        }
    }
}
return 0;
The original request was only to get the tunnel status (datapoint: tun_status) hence the graph is only one, but I expanded for other metrics available from the API.
One can always add graphs for other datapoints as they deem fit.

QuoteDISCLAIMER: All content in this article is solely a personal opinion of the author as a contribution to LogicMonitor community and is for personal use of the readers and provided as is, without assitance from LogicMonitor Support. There is no support or marketing-driven influence by any vendors or principals of any products mentioned in the article.
1