Forum Discussion

boomi's avatar
4 years ago

Perfmon Counters and NPS

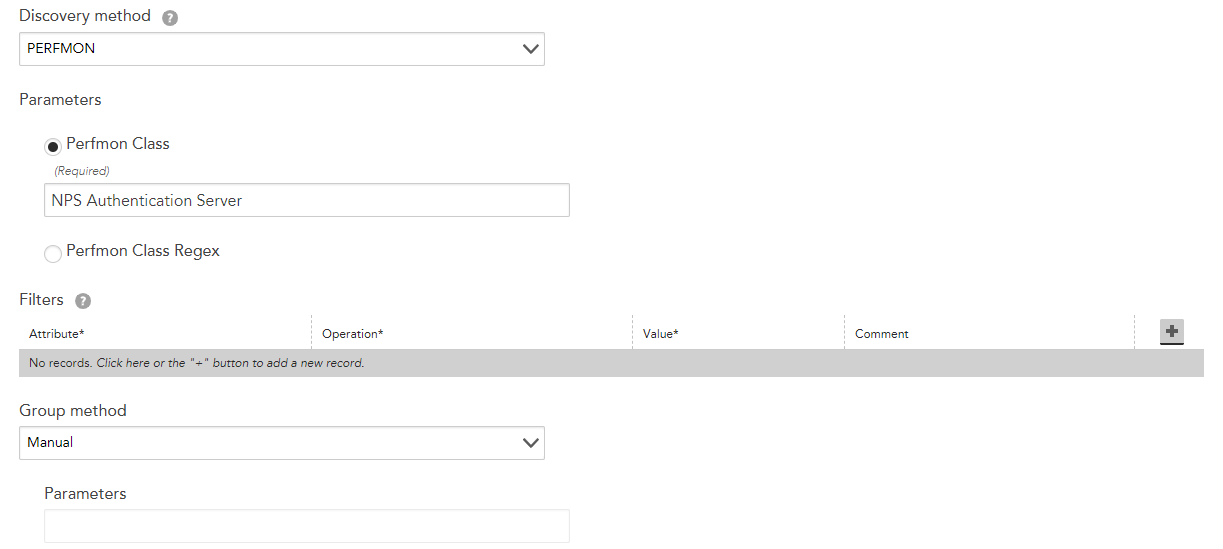
I wanted to fetch data from Microsoft NPS, which appears to be thoroughly exposed via Perfmon. I generally understand how to collect the data by referencing existing Perfmon datasources like SMTP.

I'm don't understand what format the Perfmon counters are in when I receive a response like this:


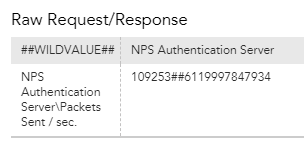
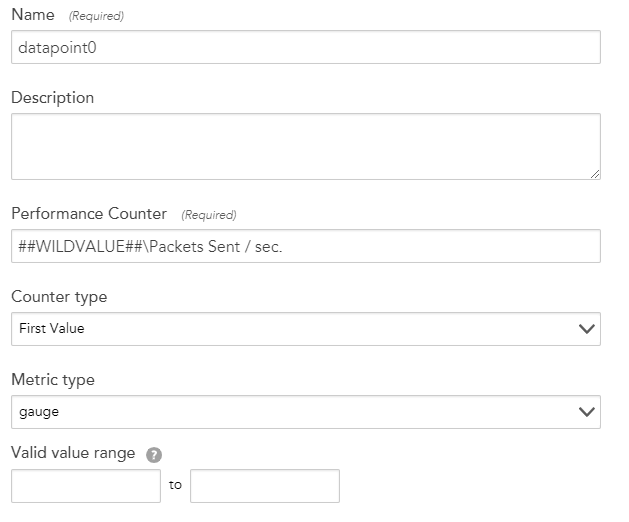
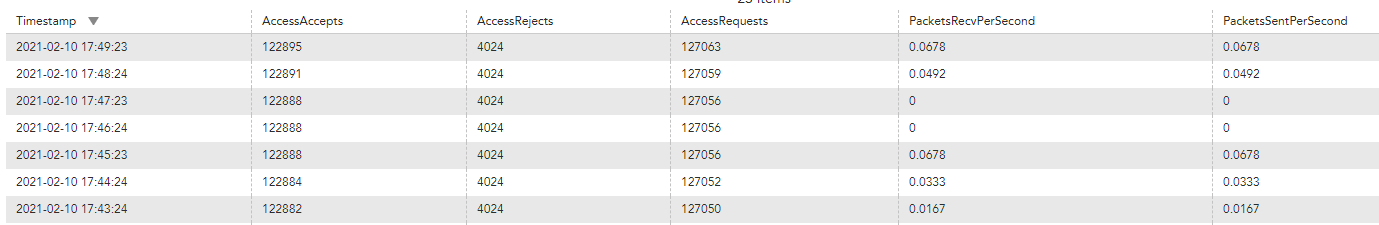
I see that I have the option of using the first value, or treating it as a ratio, but neither makes sense. This NPS server receives very little traffic, and I'm watching the live Perfmon utility read a steady '0' for this counter. Occasionally someone authenticates, and it jumps to ~0.9.

Can anyone point me in the right direction to understand this output? Thanks!

4 Replies

  • Anonymous's avatar
    Anonymous

    Can you post a screenshot of what your DS looks like so far? Not really knowing anything about the data coming back, i'd guess that what's coming in as the wildvalue should probably be discarded, and the first term of the second value should be the wildvalue. That would leave the second term of the second value as the value. You could then setup a datapoint as a counter type.

  • On 2/5/2021 at 2:14 PM, Stuart Weenig said:

    Can you post a screenshot of what your DS looks like so far? Not really knowing anything about the data coming back, i'd guess that what's coming in as the wildvalue should probably be discarded, and the first term of the second value should be the wildvalue. That would leave the second term of the second value as the value. You could then setup a datapoint as a counter type.


    Is that to say this might need to be redone as a script instead of using the built-in Perfmon collection mechanism? Or is there a way to do so with it?

    Here's the AD:


    And I have one datapoint being collected:


  • I think I figured it out. The issue is I'm retrieve "data per second" values, which need to be used as the 'derive' counter type in the datasource. I was confused because when observing Perfmon, or using "typeperf" to get the data, it's already making this conversion for you, and spitting out the rate per second value:

    typeperf "\NPS Authentication Server\Packets Received / sec."
    
    \NPS Authentication Server\Packets Received / sec."
    
    "02/10/2021 17:28:22.795","0.000000"
    "02/10/2021 17:28:23.810","0.984817"
    "02/10/2021 17:28:24.810","0.000000"
    "02/10/2021 17:28:25.811","0.000000"
    "02/10/2021 17:28:26.811","0.000000"
    "02/10/2021 17:28:27.826","0.000000"
    "02/10/2021 17:28:28.842","0.000000"
    "02/10/2021 17:28:29.857","0.000000"
    "02/10/2021 17:28:30.873","1.000053"


    I noticed when I added other counters for the absolute "Access-Accepts", "Access-Rejects", etc:

    The last two columns are Sent and Received per second. For this screenshot, I had the second to last misconfigured, but the last column shows the clue in that the the value matched one of the other counters.

    Seems like it's doing what I expect. Based on an article around counter vs derive, I believe derive with a 0 minimum value is the correct setting to use:


  • Anonymous's avatar
    Anonymous

    Yes, that will help. The difference between counter and derive is that counter expects rollover only at 32-bit or 64-bit boundaries. Derive accommodates for that but trusts that you'll put in a valid range for the datapoint so that odd results get discarded.

    Both counter and derive take the delta between the two polls and divides by the poll cycle between them in seconds. So you should end up with a rate per second.