 Employee
Dynamic Dashboards
Tokens are one of the most powerful aspects of LogicMonitor's dashboards. They make it possible to easily change the subject matter of an entire dashboard (or a group of dashboards).
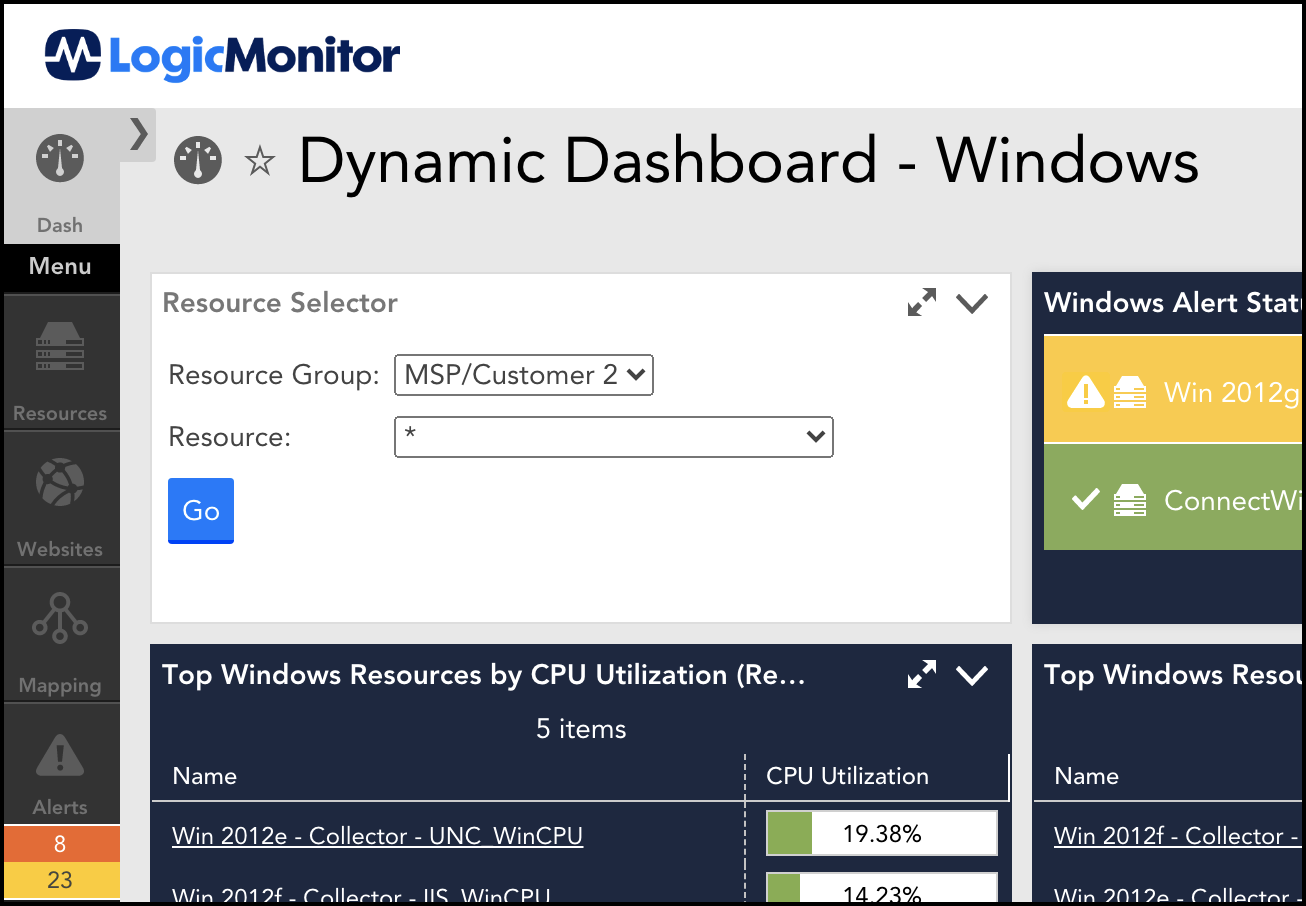
A question that comes up from time-to-time is if it's possible to dynamically update a dashboard using a drop-down menu on the dashboard itself instead of having to edit the dashboard. While there are some exciting changes coming to LogicMonitor's dashboards in the future, I wanted to see if I could come up an option that works today. The end result is a solution that allows dynamically choosing token values for groups, resources, and/or instances directly from the dashboard itself. It turned out to be a great demonstration of what's possible using LogicMonitor's API.
Assuming your dashboard is designed to take advantage of tokens (like all the bundled dashboards are), then this selector makes it easy to quickly flip between different contexts. Refer to the Creating Dashboards support article for more info on using dashboard tokens.
Some good use-cases for this dynamic selector:
- Switching between different MSP customers.
- Flipping to different cloud subscriptions or vCenters.
- Flipping between facilities, datacenters, or environments (prod, dev, QA, etc.).

Below is a link to a sample dashboard that's a variant of LogicMonitor's bundled Windows dashboard but with two new widgets: a "Resource Selector" widget and a "Read Me" text widget that describes how the selector works. The resource selector is just a normal Text widget but with some JavaScript embedded that leverages the LogicMonitor API to populate the drop-down menus and update the dashboard's tokens as appropriate.
Dynamic_Dashboard_-_Windows.json
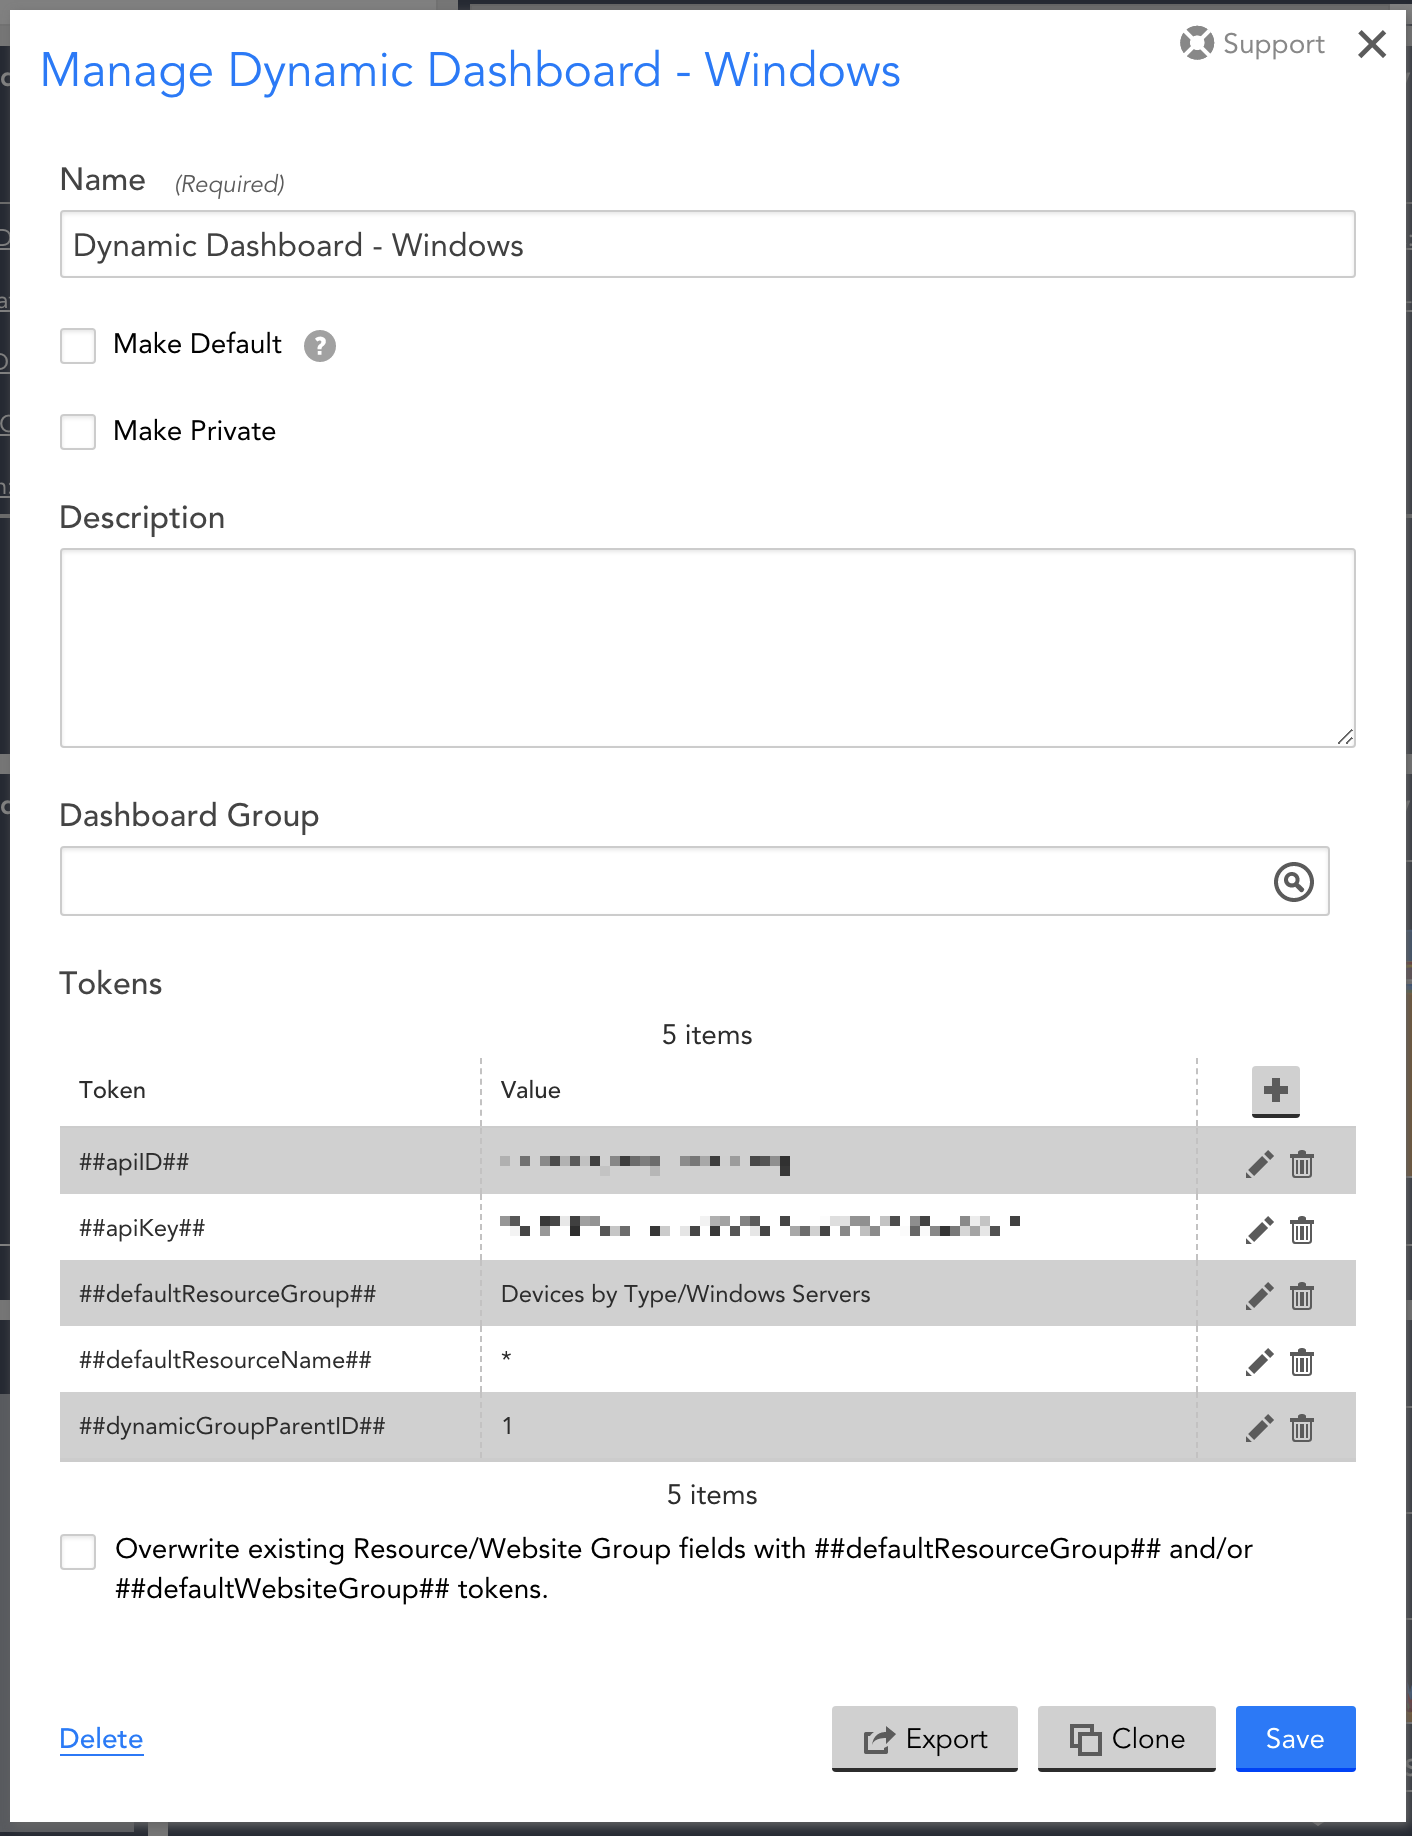
To use the above dashboard, save the linked JSON file to your local workstation, then in your LogicMonitor portal go to Dashboards and click Add > From File. Configuring the widget can be done through dashboard tokens. The tokens mentioned below will determine which dynamic drop-downs are displayed. For instance, if no 'defaultInstance' token is defined then the Instance drop-down won't appear. Refer to the token descriptions below for more details.
Required Tokens:
- 'defaultResourceGroup': a common token used by the widgets on the dashboard. The 'Resource Group' drop-down menu will update this token upon clicking Go.
- 'apiID' & 'apiKey': a LogicMonitor API ID and secret key used for REST API calls. Note: there's a place near the top of the Resource Selector's Javascript source where you can optionally hard-code these two values instead of more openly exposing them in a token.
Optional Tokens:
- 'defaultResourceName': (optional) a common token used by widgets on a dashboard for specifying the resource(s) to show data for. The 'Resource' drop-down menu will update this token upon clicking Go. If the token isn't defined then the script will hide the 'Resource' menu under the assumption that it's not being used on this dashboard.
- 'defaultInstance': (optional) Token used by widgets on a dashboard for specifying instances to show data for. The 'Instance' drop-down menu will update this token upon clicking Go. Note that if you want to use the 'Instances' menu, it requires a named resource and a datasource to fetch instances for. If the 'defaultInstance' token or 'defaultDatasource' tokens aren't defined on the dashboard OR the 'Resource' menu is set to "*" then the 'Instance' menu will be hidden.
- 'dynamicGroupParentID': (optional) The numeric ID of the parent group you want to limit the dynamic group drop-down to. Will default to the root group (ID 1) if not specified.
- 'defaultDatasource': (optional) Name of a datasource that will be used for gathering instances that dynamically populate the 'Instances' drop-down menu.
- 'hideDynamicGroupDropdown' or 'hideDynamicResourceDropdown' or 'hideDynamicInstanceDropdown': (optional) can be set to "true" to force the 'Resource Group', 'Resource', or 'Instance' drop-down (respectively) to be hidden. This allows the widget to be flexible for choosing a group, a resource, an instance, or any of them.
Enabling the Sample Dashboard
In order for the selector to work with your LogicMonitor portal's API, you'll need an API credential that has "Manage" rights to the dashboard (so the dashboard's tokens can be updated) plus "View" rights to any groups & devices you want in the drop-downs. You can learn about creating API credentials here: https://www.logicmonitor.com/support/settings/users-and-roles/api-tokens
Aside from an 'defaultResourceGroup' dashboard token, you'll need to add two tokens to the dashboard specifying the ID and key of the API login you created. You can set these by opening the dashboard's Manage dialog and adding two new tokens: 'apiID' and 'apiKey' (note: these can be added at a dashboard group-level as well).
Other tokens you set on the dashboard will help determine behavior of the selector widget. For instance, if you set a 'dynamicGroupParentID' token containing a numeric ID of a resource group, then the selector will only show groups & resources under that parent group. Likewise, having a 'defaultResourceName' token will enable the Resource selector. Refer to the "Read Me" widget for full details on all the options.

So How Does This Work?
When the "Resource Selector" widget is first loaded, Javascript embedded in its HTML source makes a call to the LogicMonitor REST API to get a list of items to populate options in the appropriate drop-downs. The widget will auto-populate parent-child menus as appropriate. For example, when a new group is chosen in the 'Resource Group' menu then the 'Resource' drop-down list will auto-update to reflect what's inside the newly chosen group.
When the Go button is clicked, the widget's script does the following actions:
- 1. Calls LogicMonitor's [Get Dashboard](https://www.logicmonitor.com/support/rest-api-developers-guide/v1/dashboards/get-dashboards) REST method to get the current dashboard definition.
- 2. Loops through the dashboard's tokens retrieved during step #1 looking for 'defaultResourceGroup', 'defaultResourceName', and 'defaultInstance'. If found, it updates them in memory with the values chosen on the drop-downs (unless the respective field was set to be hidden).
- 3. Calls LogicMonitor's [Update Dashboard](https://www.logicmonitor.com/support/rest-api-developers-guide/v1/dashboards/update-a-dashboard) REST method to save the new token values.
- 4. Refreshes the page to reflect the new values.
How To Use This On Other Dashboards
Since the selector widget was designed to leverage tokens, applying it to another dashboard is as simple as cloning the widget to another dashboard and configuring any appropriate dashboard tokens (if not already set at the group-level).
Note: if you don't want to set your API ID and key as dashboard tokens, there's a spot you can set them inside the selector widget's source code instead. That allows you to hide them, especially if the user only has read-only privileges for the dashboard since they won't be able to edit widget's configuration. I'll post a follow-up comment on where to do that.


