Neophyte
Does anyone have any experience with monitoring Windows Processes?
I’ve checked the community for datasources and I don’t see anything to what I’m specifically looking for. Our organization currently utilizes the Microsoft_Windows_Services datasource (modified a little bit for our specific needs) to monitor services. I’m looking for something similar to monitor windows processes.
Similar to the Microsoft_Windows_Services datasource, what I am hoping to accomplish is provide a list of keywords that will either match or be contained in the process name that I want to monitor, provide a list of machines that I want to monitor those processes on, and then get alerted on if those processes stop running. Some issues I am running into so far are:
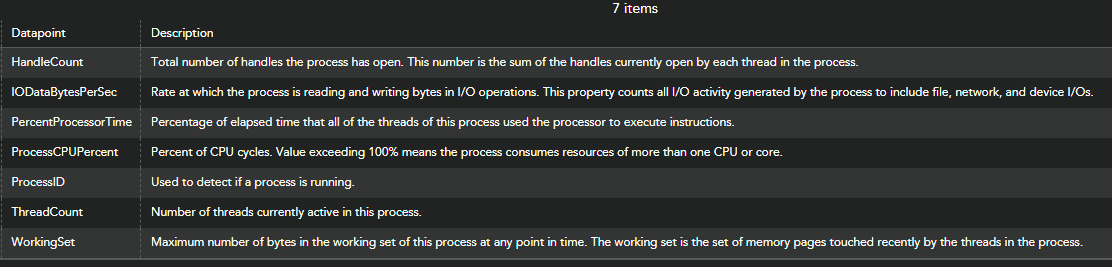
- Win32_Process always returns a value of NULL for status and state. So I cannot monitor for those two class level properties.
- Powershell’s Get-Process does not return status or state, rather it just looks for processes that are actively running, so I would need to get creative in having LogicMonitor create the instance and what value to monitor in the instance.
- Some of the processes I want to monitor create multiple processes with the same name, and LogicMonitor then groups them all together into one instance, which makes monitoring diffucult.
- Some of the process I want to monitor are processes that only run if an application is manually launched, which means that again I will need to get creative in how I set up monitoring because I don’t want to get alerts when a process that I know shouldn’t be running is not running.
Because the processes I am trying to monitor are not going to be common for everyone everywhere, something that other people could do to try to replicate my scenario would be:
Open Chrome. When Chrome is launched, you will get a processed called “Chrome”. Now, open several other tabs of Chrome, you will just get more processes named “Chrome”. Now, keeping in mind the points I made earlier, set up monitoring to let you know when the 3rd tab in Chrome has been closed, even though the rest of the Chrome tabs are still open. How would you break that down? My first thought would be to monitor the PIDs, however, when you reboot your machine, your PIDs will likely change. Also, I don’t want to have the datasource wild value search by PID, because that would get confusing really fast once you have 2 or 3 different PIDs that you want to monitor.
All suggestions are welcome, and any help is greatly appreciated. Bonus points if you can get this to work with the discovery method as Script and you use an embedded Groovy or Powershell script.
There are a couple of issues you’ve brought up, so I’ll answer the most straightforward ones first:
Usually if you want to do something like this, it’s a good idea to plan to clone and modify the default datasource; generally you’ll want to use active discovery instead of the “add other monitoring” workflow that the default datasource uses, which requires the end user to manually manage the instance lists.
There are a few ways to use patterns in active discovery to build instance lists across different resources. A common pattern which will allow you to use one datasource for a number of different processes is to store matching expressions in a property, then assign that property to either resources or resource groups (which allows for inheritance) On this page. there’s an example where the wmi attribute “name” has a regexmatch filter “store|mad|.*exchange.*” which will require a processes name to match that regex pattern. The approach I’m talking about would have you create a resource property like importantWinProcessMatch and then put a custom token “##importantWinProcessMatch##” into the value field. Then you would assign appropriate patterns to different based on what their target process lists should be. For example, if you are running a custom application with a critical process on a group of machines, you could create a pattern for all the processes that should be monitored for those machines and assign it to that group. (A similar construct in a different context is how the default “Windows Security Event Log” event source uses a “##FILTEREDEVENTS## token to allow for different devices to have different filters while using the same logicmodule) It’s also possible to automate property assignment directly on individual resources if there’s some other source of truth available. This tokenized filter pattern works with any kind of discovery, although if you want to bring the pattern matching into a script, you will have to handle the pattern match in the script using the constructs of the script’s language. Of course, if you do it this way, the complexity of the script is limited mainly by your own imagination.
Another decision you will want to make is how many datasources you would like to end up with. Using tokenized and/or scripted discovery lets you potentially reuse the same datasource again and again across different populations of machines for different sets of processes. Alternatively, you could decide to make clones specifically to meet certain needs. I believe LM has produced examples of both, but here are some pros and cons for the approaches:
- Reuse
- Fewer datasources to maintain (without scripts, the base datasource is unlikely to need maintenance, though)
- All instances appear as one kind of thing in any graphs, reports, dashboards
- Can cover more targets just by assigning more properties (no need to keep changing the datasources)
- (con) The properties and their patterns can be complex; you’ll need to craft a property for each combination of processes to be monitored for each datasource and make sure that property is assigned to or inherited by all the devices
- Targeted
- More datasources
- Instances are more specific to the target workload
- Possibly easier to deal with if there are a lot of different intersections of sets of processes (no need to worry about AND-ing the match expressions)
- Can more readily customize alert messages to the specific process patterns the datasources cover
- Each function can have its own set of filters or scripts handling discovery, making them individually less complex and easier to understand and maintain
Your intent to monitor process only once they’ve been started is similar to the way that we only monitor SNMP interfaces once they’ve been plugged in. The pattern we used: set up the discovery so that it runs regularly and frequently, and that the filters you’ve chosen won’t discover them before they are active, but set the discovery not to “automatically delete instances”, then they will be discovered, but then continue to be exist and be polled by the collector even after they’ve been shut down or disappeared.
At the end of it all though, it appears that you have discovered that the classes that these datasources are built on seem to have some structural problems when it comes to monitoring. Specifically: the quality of the data they report is not everything one might wish for, and the naming and other metadata is not great either. Neither the names nor the id’s make good, unique, durable instance IDs which would support a reliable instance name. This is a limitation of the WMI class and probably one of the reasons you don’t see more extensive use of process monitoring in the provided datasources. To use your example: I can’t tell you how to correlate the third tab of chrome (or most things running on windows) directly to a process name in a reliable fashion. (And it’s tough to generalize from the specific instances where it does work well). As with all things monitoring, there’s a trade off between very general approaches, like monitoring a list of processes, and getting more specific, like monitoring specific processes, or the specific programs that create them, and the right approach will depend on how much information you want, how important the systems and software are, and the amount of time and effort you’re inclined to put into it.
Some approaches you might also consider:
- Monitoring the target applications directly: use datasources that connect to them and directly evaluate their function. A much more direct approach than process monitoring
- LM Logs: set up LM Logs, look for undesirable process-related events, and set up pipeline alerts for those patterns
- Event Sources: same approach as for LM Logs, but provides less context
- Reuse