 Advisor
Method to specify TITLE of Graph in Reports
We need a way to be able to specify the Title of any graph when we are creating reports. The OOTB method uses a very un-discernable title for something simple as CPU USAGE.
It displays: "WinCPU with instance * on datapoint CPUBusyPercent".
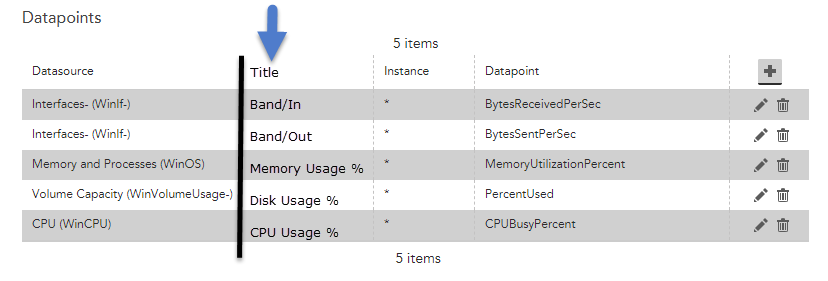
Any client looking at this report is going to ask WTH does this mean? We need a way to be able to specify the %TITLE% on each Datasource we specify when building a report. IF you can add a column to the DataPoints section called Title:

Example in the above report each category is titled with:
CPU Usage % title is: WinCPU with instance * on datapoint CPUBusyPercent
Memory Usage % title is: WinOS with instance * on datapoint MemoryUtilizationPercent
Disk Usage % title is: WinVolumeUsage- with instance * on datapoint PercentUsed
Bandwidth In: WinIf- with instance * on datapoint BytesReceivedPerSec
Bandwidth Out: WinVolumeUsage- with instance * on datapoint PercentUsed
None of these titles make any sense to anyone who's trying to read the graphs. Can we please just have a way to specify the title.