Archana Neophyte
7 years agoNeophyteHow to get the aggregate values from the dashboard
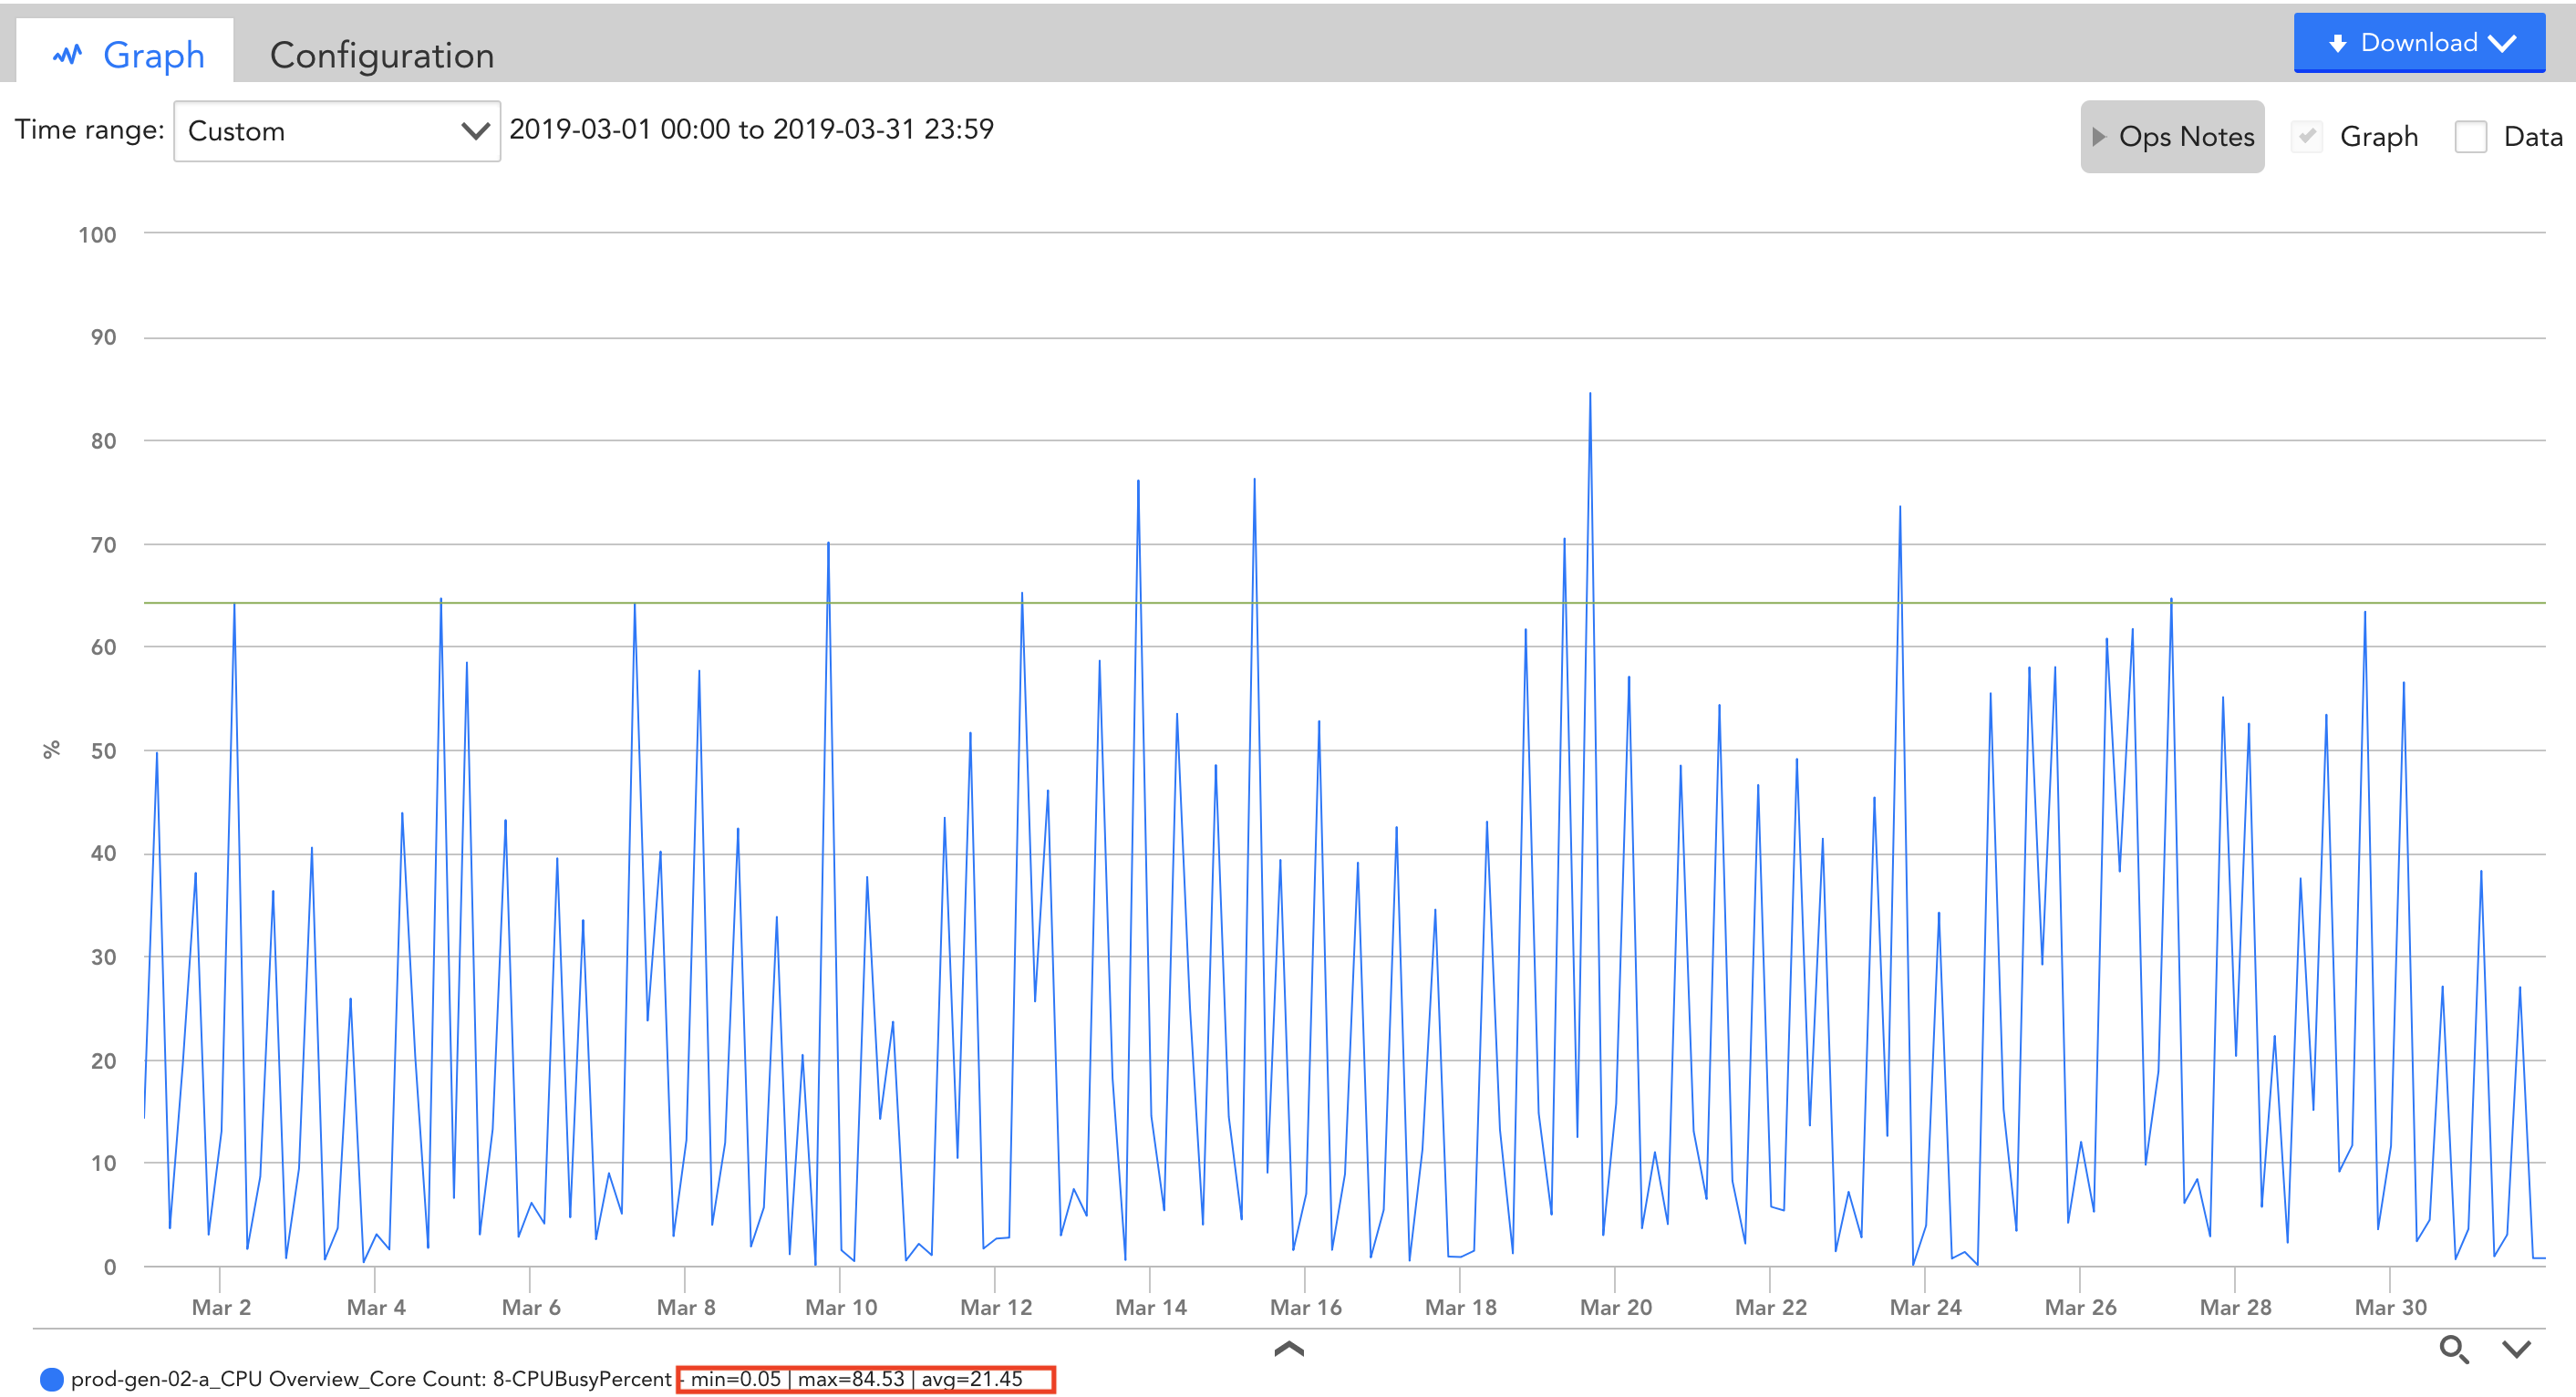
I have a graph widget, which shows the trend of CPU usage for last 24 hours. At the bottom of the graph, I can see the aggregate values like, min, max and average which is calculated for the whole time period selected. Please refer the highlighted part in the attached screenshot.
I need those aggregation values of each panel in the dashboard, to be send to email on daily basis. I guess I can get this with the help of option called `Report`. I have gone through the LM document which explains about creating Report on LogicMonitor. But I am not sure that is the way to do.
Could anyone please let me know if there is any other way to go this.