Forum Discussion

Archana's avatar
Archana
Icon for Neophyte rankNeophyte
6 years ago

How to get the aggregate values from the dashboard

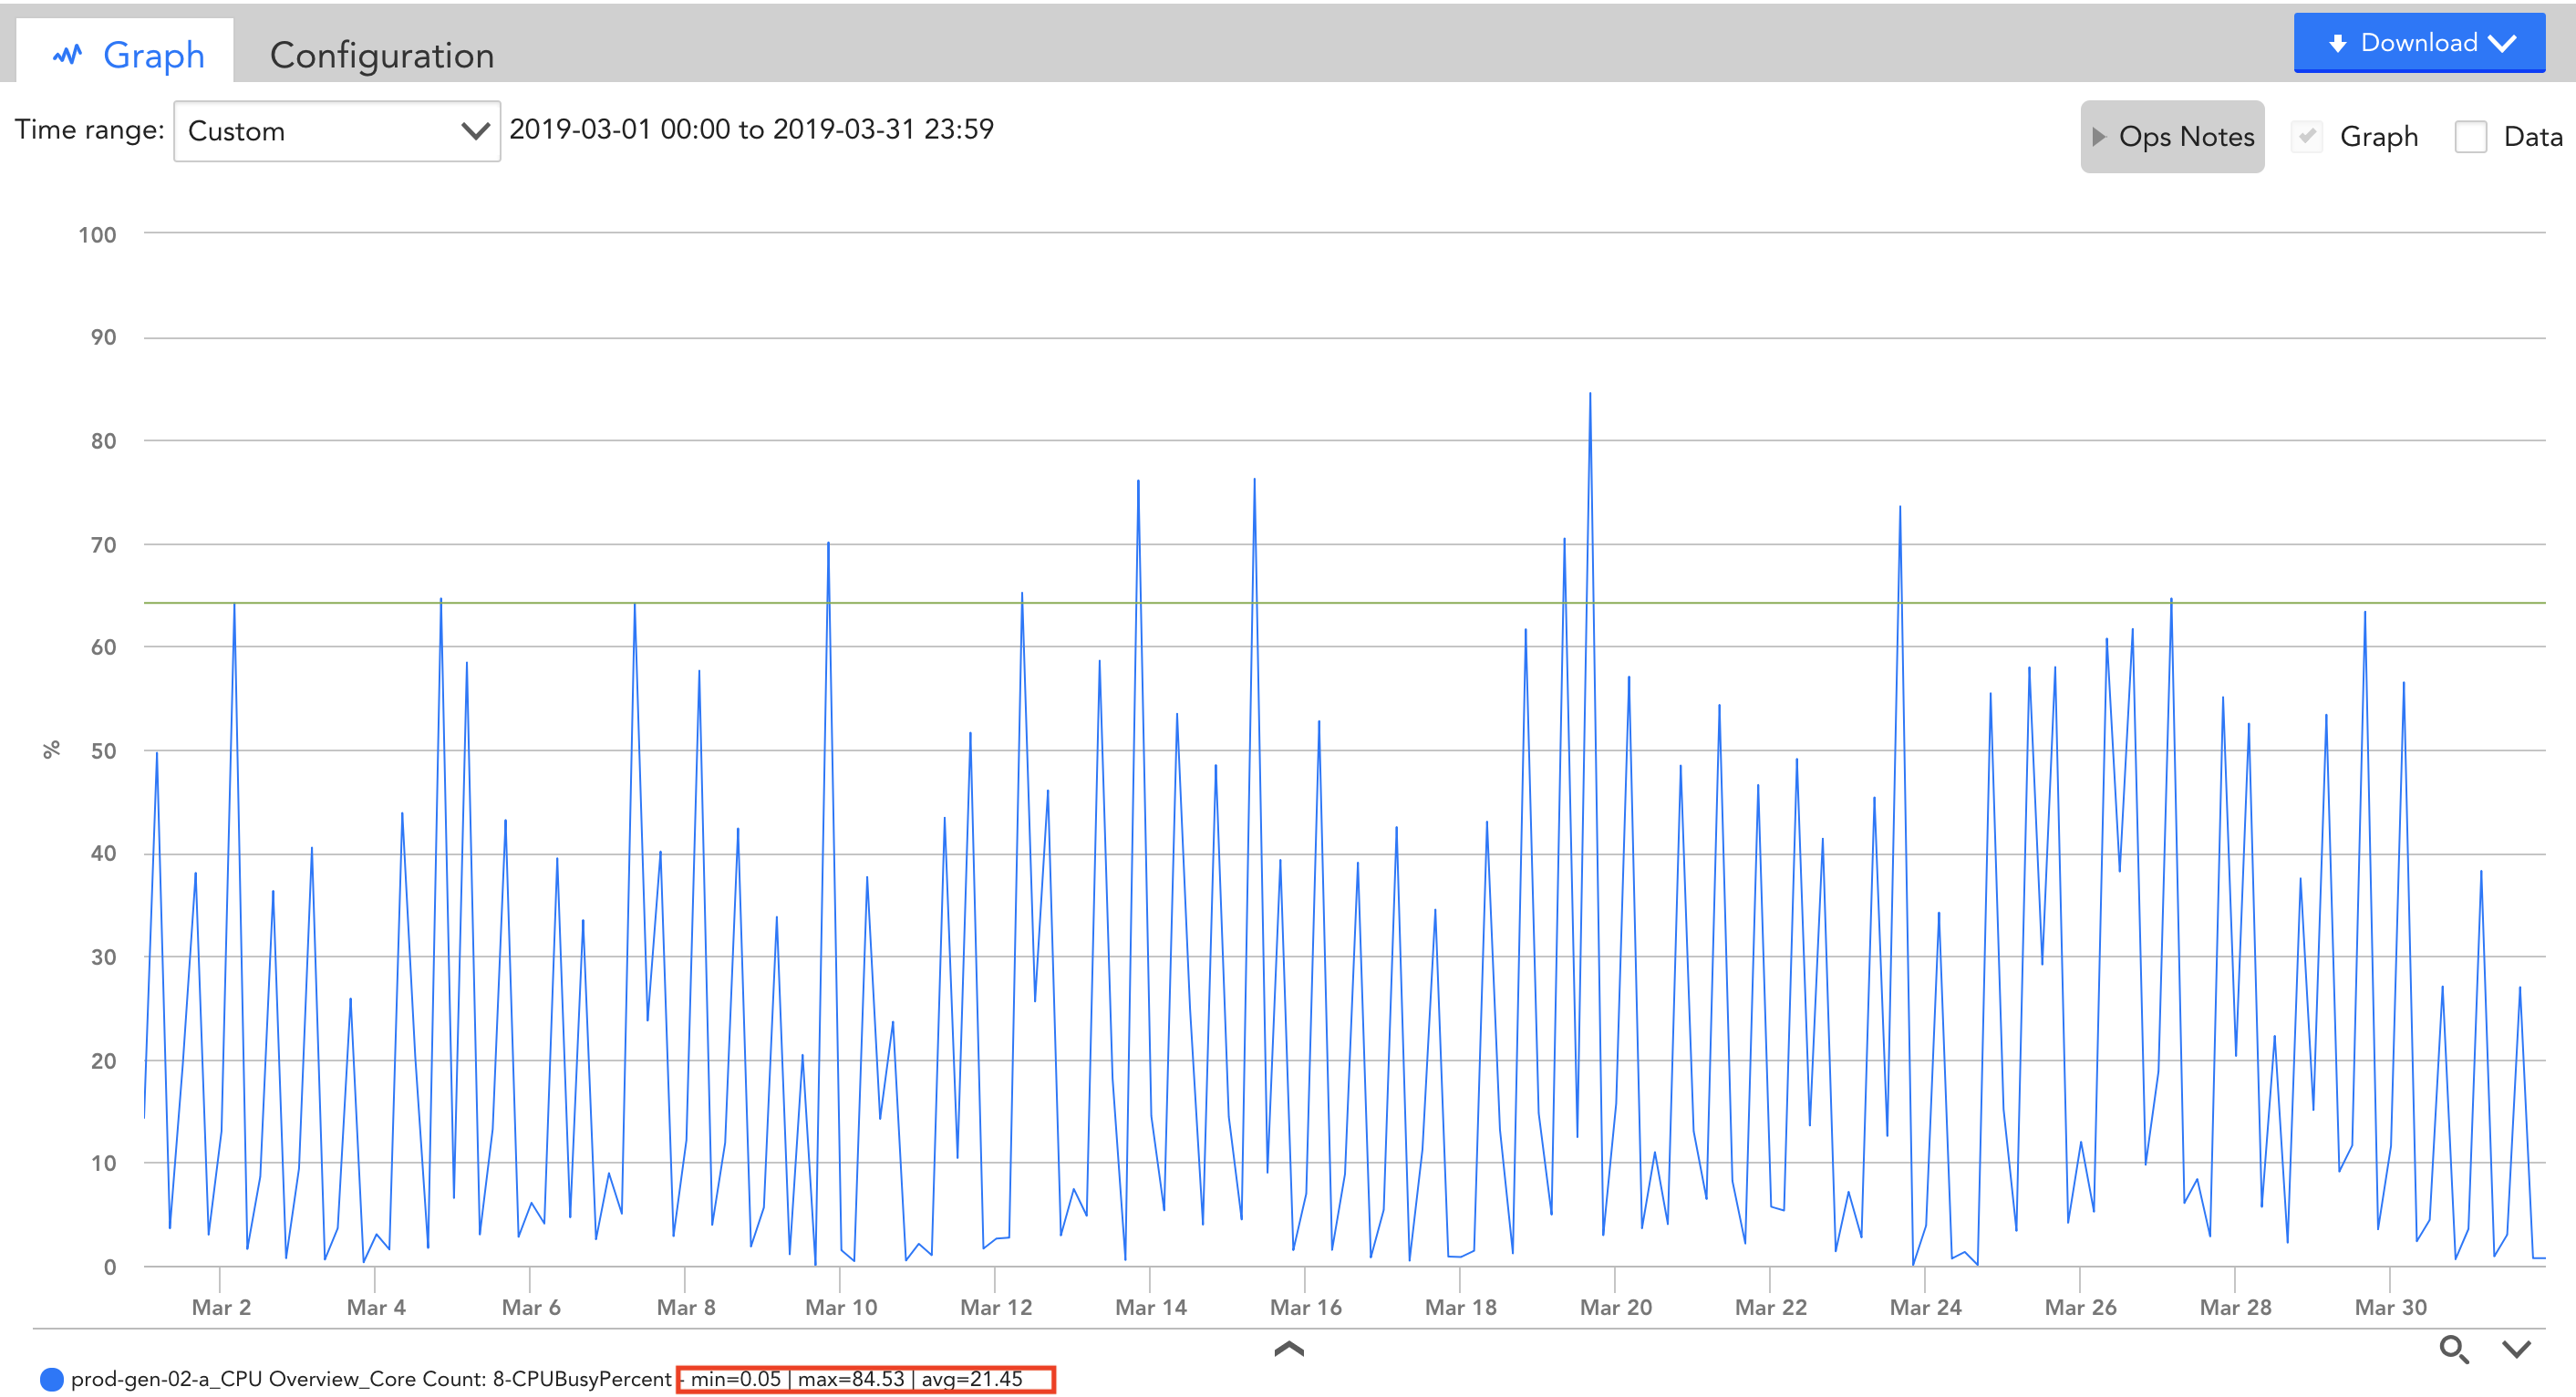
I have a graph widget, which shows the trend of CPU usage for last 24 hours. At the bottom of the graph, I can see the aggregate values like, min, max and average which is calculated for the whole time period selected. Please refer the highlighted part in the attached screenshot.
 

I need those aggregation values of each panel in the dashboard, to be send to email on daily basis. I guess I can get this with the help of option called `Report`. I have gone through the LM document which explains about creating Report on LogicMonitor. But I am not sure that is the way to do.

Could anyone please let me know if there is any other way to go this.
  • 7 minutes ago, Archana said:


    Is it possible to display only these single vlaue aggregate values of respective metrics (min, max, avg) in any of the LM widget?

    This is nothing but I need to display these boundary values separately (probably as like big number display) without clicking and referring the dropdown of these graph widget manually.

  • On 4/23/2019 at 2:52 PM, Archana said:

    I have a graph widget, which shows the trend of CPU usage for last 24 hours. At the bottom of the graph, I can see the aggregate values like, min, max and average which is calculated for the whole time period selected. Please refer the highlighted part in the attached screenshot.
     

    I need those aggregation values of each panel in the dashboard, to be send to email on daily basis. I guess I can get this with the help of option called `Report`. I have gone through the LM document which explains about creating Report on LogicMonitor. But I am not sure that is the way to do.

    Could anyone please let me know if there is any other way to go this.


    Is it possible to display only these single vlaue aggregate values of respective metrics (min, max, avg) in any of the LM widget?

  • Sounds like the Resource Metric Trends Report might meet your needs. In LogicMonitor there is a whole section (page) for Reports. On the left side there is a "Report" button above Settings. In there you can create various reports:

    1. 1. Add > Report
    2. 2. Click on Resource Metric Trends button.
    3. 3. Give the report a title, desc and time frame (last 30 days for example).
    4. 4. Choose your resource group(s) and/or resource(s) you want to report on.
    5. 5. Choose the Datapoint you want to show, like CPU Overview_Core Count.
    6. 6. Play with the other options like HTML vs PDF and reports types.
    7. 7. Skip the scheduling section and review what it looks like in the browser. Once it looks the way you want...
    8. 8. Enable Generate a Report on a Schedule, setup a schedule and email it will be sent to.

    You may want to have it send to yourself at first to see what the email looks like. Depending on the type of report, some of them will expire after some time. It will also put your name on the report, incase you are email this to your customers (MSP stuff).

    1.