Forum Discussion

DanB's avatar
DanB
Icon for Advisor rankAdvisor
4 years ago

Is there a way to export data source to a template file; CSV?

So we are in the final phases of rolling out LogicMonitor and now the daunting process of Alert Tuning has rolled upon us. In our old monitoring solution we has it very much tweaked and customized and overall all alerts were around ~400-600ish. 

In LogicMonitor we are currently at 13000+. We need to seriously tune up the Datasources and we need a way to show our SME's what each datasource is monitoring and what it alerts on, what thresholds, etc.. 

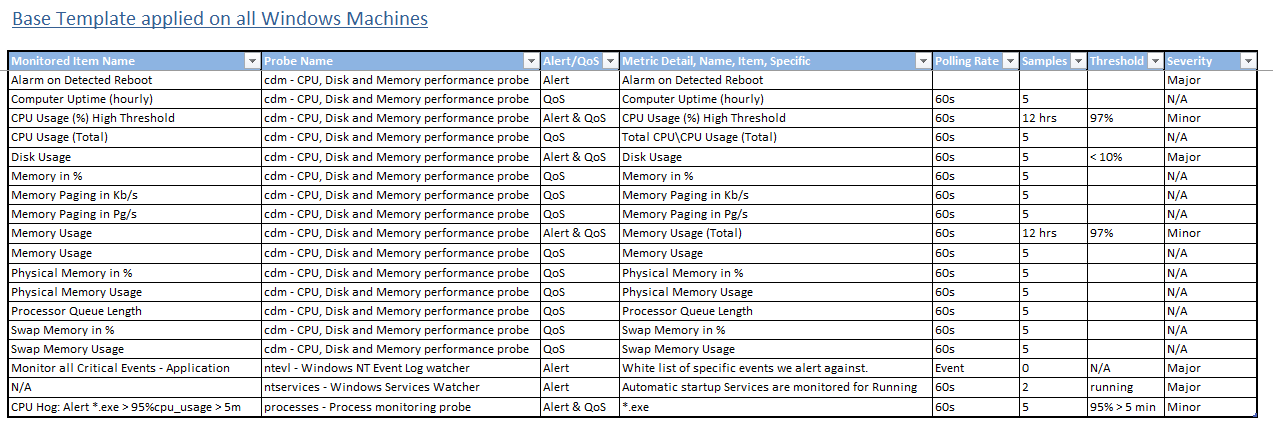
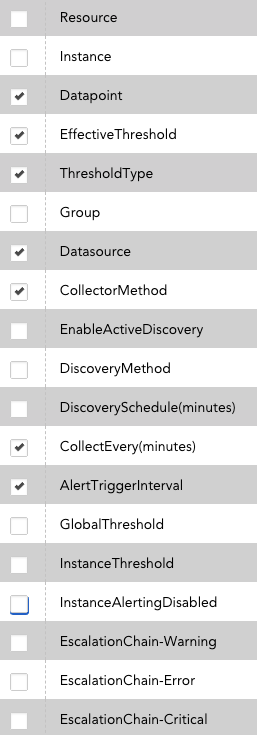
Is there a way to export the Datasource's Monitoring Template to a CSV file so that we can reference that and our SME's can then say turn off, adjust etc..

I see in the reports section there is a "Alert Threshold Report" but that lists out every single datapoint instance on a group/resource and we don't want that.
We need what the base DS template looks at and uses and applies to each matching resource.


6 Replies

  • Anonymous's avatar
    Anonymous

    Not sure I get why the report doesn't fit the bill. Feel free to expound on that.

    In the meantime, to summarize your needs: for each DataSource that has instances, show each datapoint's name, description, and threshold (if there is a threshold). Is that right? I can probably spend some time mapping out which API calls you'd need to do for this.

    As an incentive to me (i'm mostly joking, i'm already looking in postman at the api calls to do this) can i get a little quid pro quo? I need customer feedback on a href="https://communities.logicmonitor.com/topic/5871-your-feedback-requested-community-rank-names/" rel="">this.

  • Anonymous's avatar
    Anonymous

    Short answer is that you can export the XML definition of any DataSource by navigating to the DS under Settings>>DataSources. Under More, there's an Export function. 

  • Hey Stu,

    So as an MSP, we get asked all the time from client(s) and new potential new clients what'sour monitoring template for each different technology.

    We needed to create an excel sheet with each different Technology and then listed each UIM probe, what it collected and if it alerted what threshold it alerted at, the time it polled, samples etc.. 

    Example Windows Base Template:

    We had an excel workbook with 30+ different technologies each on their own tab that were the mostly commonly in use and could share that with clients.

    I saw that export option but that isn't going to help b/c that exports into XML. I need a csv format. I can't send an xml to client(s) and say go read that.  ?

    Regarding your questions:

    Not sure I get why the report doesn't fit the bill. Feel free to expound on that.

    >> B/c that lists every single datapoint instance. I need just the general what would be picked up by the monitoring tool. (See pic above)

    In the meantime, to summarize your needs: for each DataSource that has instances, show each datapoint's name, description, and threshold (if there is a threshold). Is that right? 

    >> Yes this is correct. Exactly or as similar to what's listed in the pic above. 

    As an incentive to me can i get a little quid pro quo?

    >> I know many LM users get asked this all the time. I know we did and will and will need to re-create this with LM as our new tool.


  • Anonymous's avatar
    Anonymous

    What if you did this: start with the report in CSV format. Only include these columns in the report. Then just remove the duplicates from the report. I know it involves post-processing the output, but take a look and see if that gets you what you want. I ended up with 1440 thresholds, but I have a bunch of group, device, and instance level thresholds. You could exclude those as well just by filtering on the ThresholdType column. 

  • Hi @Stuart Weenig so getting back to this thread, so the Alert Threshold Report is a good start but still not what we need exactly. We need a similar report but one that can pull data from the DataSources as a source to base the report on. This should be OOTB and not have to be done thru a script. 
    It would be very helpful for those who need this type of report if the OOTB "Alert Threshold Report' included the DataPoint description as a column in the report? Is that possible?