 Employee
Bringing Website (web and ping check) data into Service Insights
Currently, you cannot pull Website (web and ping check) data into Service Insights.
These LogicModules permit you to do just that...
STEP ONE:
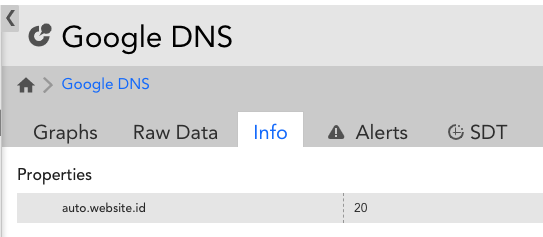
To add individual Website Checks (as opposed to a group of checks) you'll need to identify each check's ID number; as currently these are not visible in the UI I've written this PropertySource to assist: Website_Display_ID, locator code: DK4CJR
You can apply this to any collector-monitored resource, or run its script externally. You'll guess from its AppliesTo field that I've applied it to an existing Service Insight in my account, that has a collector assigned to it. This will find the ID of each Website check from the LogicMonitor API, and write those back as a property, auto.website.id, to each Website check, to enable you to easily see the IDs (This will not affect other existing properties, thanks to the use of the PATCH API method):
This PropertySource demands resource properties apiaccessid.key and apiaccesskey.key be set on the applied resource; these must be the ID and Key of a LogicMonitor API token pair that has management rights to all Website checks (as the script will be making changes to these).
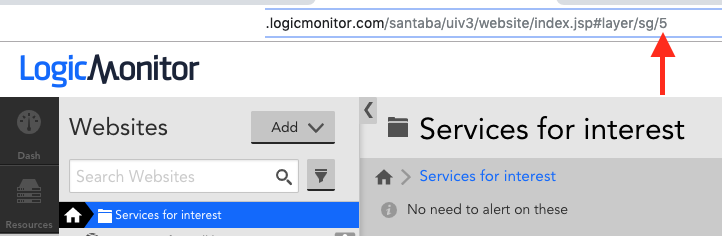
Website check group IDs can be identified within the LogicMonitor URL if you 'focus' on a group - no need for any clever scripting:
STEP TWO:
Next, the datasources, of which there are four (because Web and Ping checks return different values, and overall and per-checkpoint metrics also differ within a check type):
Websites_PingCheck_Overall: 2RZ6XF
Websites_PingCheck_PerLocation: FLMNT2
Websites_Website_Overall: 364ZHF
Websites_Website_PerLocation: TA4ZGJ
All four of these call the LogicMonitor API for whichever Web and/or Ping checks you so choose, and find the checkpoints in use (within Active Discovery) and pull the existing metrics back from our TSDB for each of these.
These also can be used on any collector-monitored resource; as you can assign a collector (and therefore failover) to a Service Insight, I recommend doing that rather than picking a device (even a collector device) that may be transient, even if only in the longer term.
All four of these have AppliesTo rules of:
lmapi.websiteread.id && lmapi.websiteread.key && (website.IDs.csv || website.GroupIDs.csv)
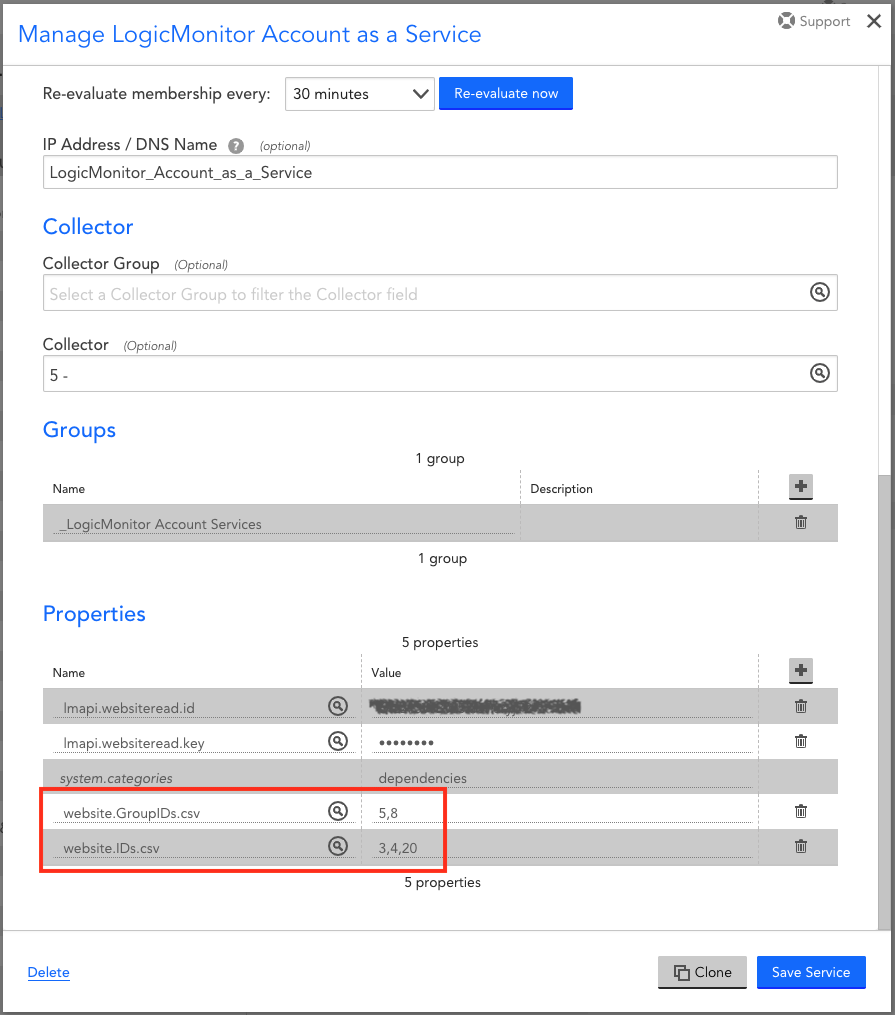
lmapi.websiteread.id and lmapi.websiteread.key are properties to set on whichever resource you choose to attach these DataSources to; these should be the ID and Key of a LogicMonitor API token pair the has read access only to the web checks that are relevant to the Service Insight in question. If you use credentials that permit access to all Website checks, anyone with admin rights to the Service Insight (but not to the entire platform) could guess at Website check IDs other than those they are permitted to see. In some environments this will not be a concern; in an MSP customer it could be (if you permit your customers to edit their own Service Insights). You'll notice that in this case the ID is left in plain text (as a .id property not .key) to make identification of the token in use possible.
You'll also need to set at least one of the other two properties - website.IDs.csv would be a comma-separated list of individual Website check IDs (as revealed by the PropertySource), whilst website.GroupIDs.csv would be a similar list of Website check groups, as seen in their URLs.
Either or both can be set:
These will cause the DataSources to apply; Active Discovery will then find the names and checkpoints for each Website check defined, both individually and within groups (any overlaps will result in one discovery only).
The collection scripts will then bring in the most recent metrics for each Website check on the defined polling interval - NOTE that as built, the DataSources all poll on a five-minute interval, to match the default / most commonly-used Website check interval. If your Website checks are at a different interval, please tailor the DataSources to suit. If you have a range of intervals defined, you can clone/replicate these provided the interval is consistent across the checks being brought in to the Service Insight. If you have the DataSources polling at different intervals to your Website checks, you'll either miss data or have duplicated values.
At this point, you have a replica of your selected Website checks data visible under these DataSources, under whichever resource you've set the properties on. Even if this is a Service Insight, this doesn't make the Service Insight consider them without one more step.
STEP THREE:
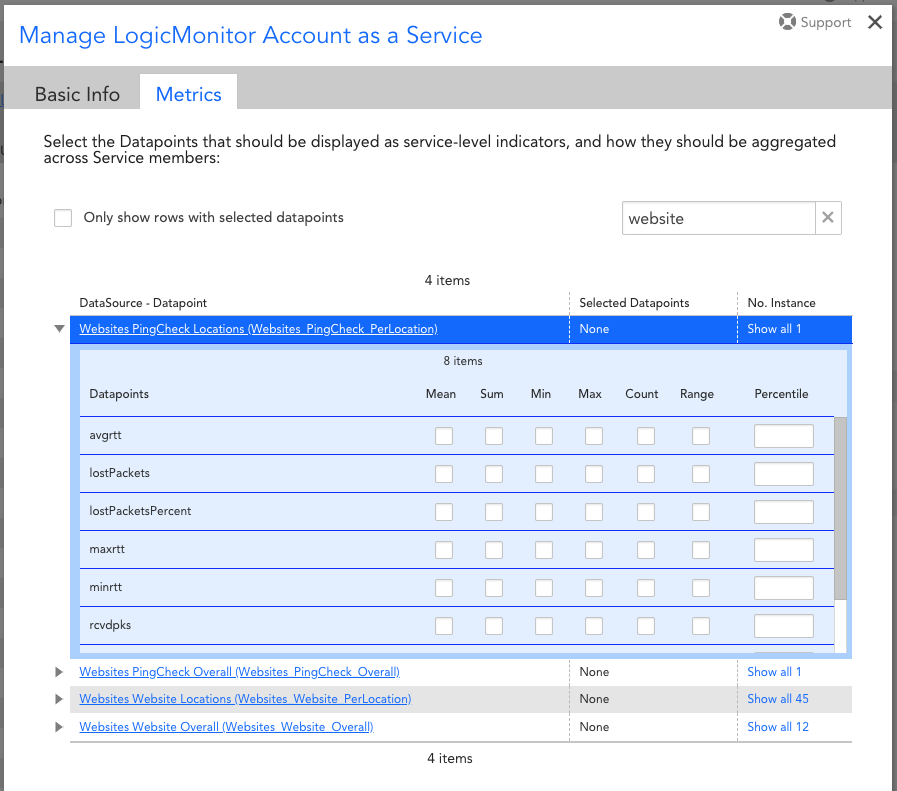
You can now configure the Service Insight to consider the metrics from these DataSources, either by adding the DataSources as Individual Instances, or within the broader Members field:
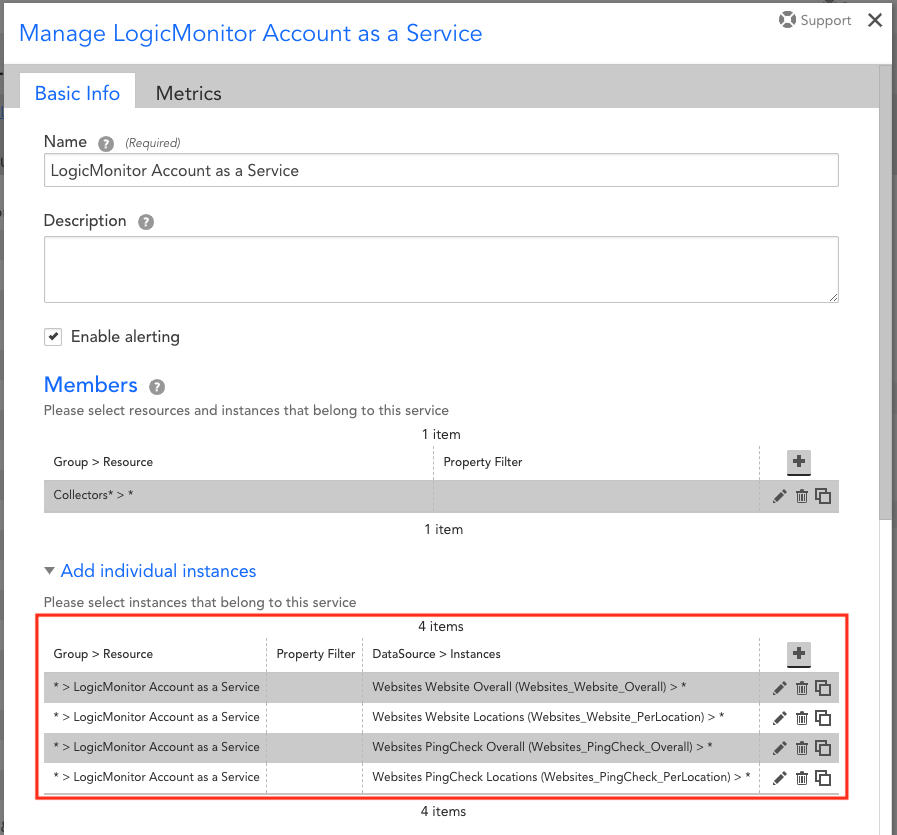
Their metrics are then available to be added to the Service Insight for consideration towards the overall Service health:
DISCLAIMER: As with everything within this area of the community forum, this is a customised extension of the LogicMonitor platform and not a core feature. It is therefore NOT SUPPORTED by LM Support. Scripts are not vetted to the "Gold Standard" of our core LogicModules. If you have questions or issues with this customisation, please comment here and I will do my best to respond in a timely manner.