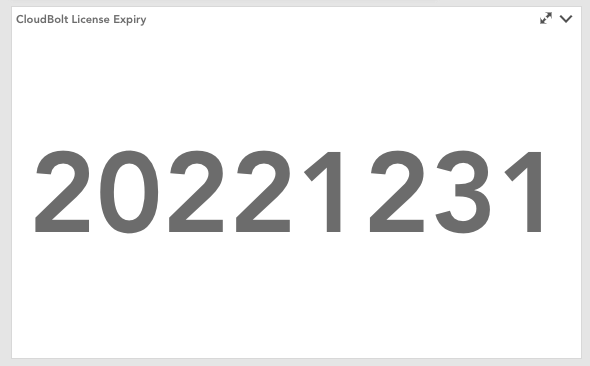
Big Number widget showing a date?


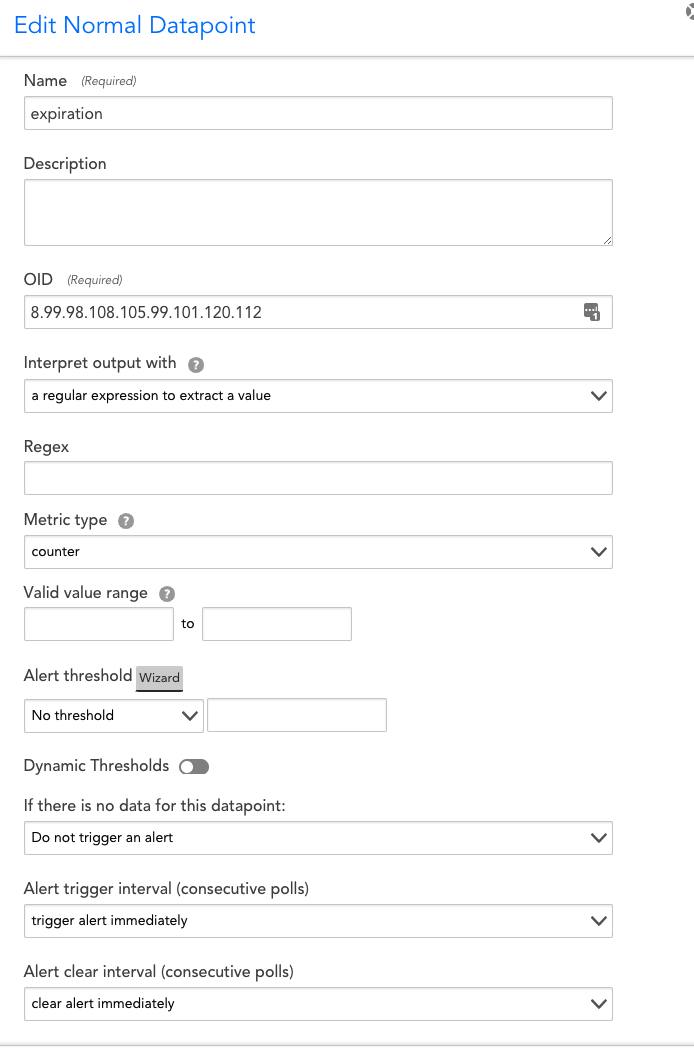
So I'm wanting to create a new widget that will display a static date which is pulled from a datasource that's using SNMP to get the date value. The raw value is in a format like: 20221231

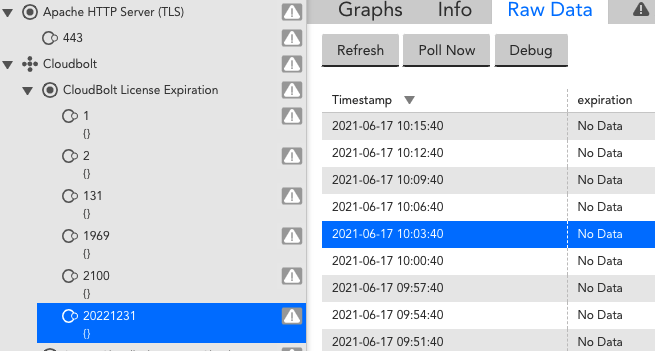
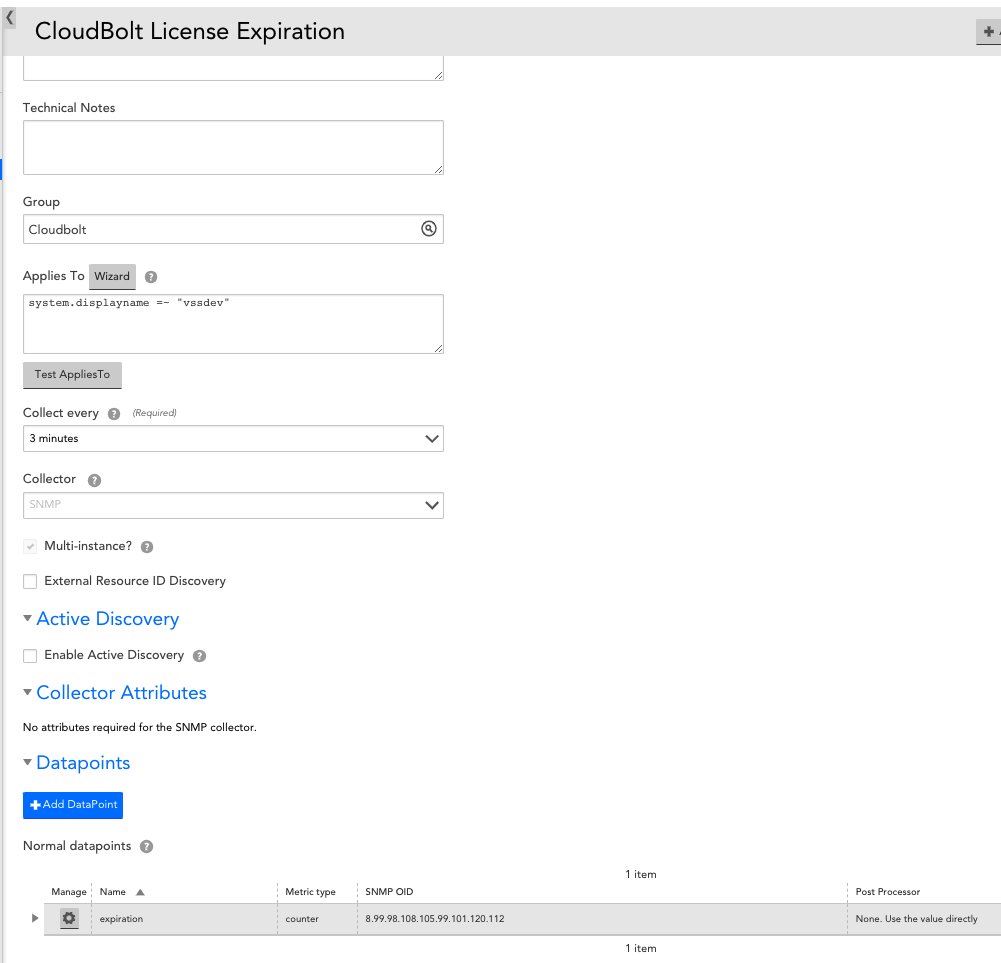
I've tried setting the datasource to no post processing, and Ive got it associated to a single specific host. When I manually poll I get the value I'm looking for but when I view the Raw Data under the Resource it says no data. So I think I've done this all wrong. Anyway I'm hoping some kind stranger and point me in the right direction for creating widgets correctly :)


17 replies

Show us a screenshot of your datapoint defintion.

27 minutes ago, Stuart Weenig said:

Show us a screenshot of your datapoint defintion.

Ooops, Sorry hopefully the below will help.


Ah, your datapoint is setup as a counter metric type. This means that logicmonitor is trying to take the delta between each poll and the previous poll. Think of it this way, if you were trying to gauge the speed of your car and all you had was the odometer, you'd take a reading, wait 5 or 10 minutes, then take another reading. You'd take the difference between the two readings and divide by the time to get miles per hour. This is what counter metric type does. It takes the difference between two polls and divides by the time between them to get the average rate during the poll cycle. Trying changing to gauge and see what you get.  Also, your post interpreter is using regex, but you didn't supply a regex expression. I assume the SNMP poll just returns the number 20221231, so you shouldn't need any interpretation, just use the value directly.

Looks like you're using an extension on NetSNMP to get the cblicexp output, yeah? You might consider the easier SSH mechanism. However, if it's working, let sleeping dogs lie, right?

On 6/17/2021 at 12:33 PM, Stuart Weenig said:

Ah, your datapoint is setup as a counter metric type. This means that logicmonitor is trying to take the delta between each poll and the previous poll. Think of it this way, if you were trying to gauge the speed of your car and all you had was the odometer, you'd take a reading, wait 5 or 10 minutes, then take another reading. You'd take the difference between the two readings and divide by the time to get miles per hour. This is what counter metric type does. It takes the difference between two polls and divides by the time between them to get the average rate during the poll cycle. Trying changing to gauge and see what you get.  Also, your post interpreter is using regex, but you didn't supply a regex expression. I assume the SNMP poll just returns the number 20221231, so you shouldn't need any interpretation, just use the value directly.

Looks like you're using an extension on NetSNMP to get the cblicexp output, yeah? You might consider the easier SSH mechanism. However, if it's working, let sleeping dogs lie, right?

Thank you Stewart.. my graph now shows a value.  So can I ask how can I setup a Big Number widget correctly displaying this value?

That part is pretty easy. Just find the dashboard you want to add the big number widget to (or create one) and use the dashboard menu to select the "Add Widget" option. Then pick big number. Then pick the device, datasource, and instance containing your data. Pick any other settings you want to customize and you should be good to go. This article may help: https://www.logicmonitor.com/support/dashboards-and-widgets/widgets/big-number-widget

35 minutes ago, Stuart Weenig said:

That part is pretty easy. Just find the dashboard you want to add the big number widget to (or create one) and use the dashboard menu to select the "Add Widget" option. Then pick big number. Then pick the device, datasource, and instance containing your data. Pick any other settings you want to customize and you should be good to go. This article may help: https://www.logicmonitor.com/support/dashboards-and-widgets/widgets/big-number-widget

VERY nice!  So last question (I promise) Can LogicMonitor manipulate the datasource values to make the display more human readable?  For example here is my new Big NUmber widget: 

Is it possible to say seperate the numbers by (.) periods? Add dashes or otherwise treat his value as a date and display accordingly?

There's no way to apply formatting. However, you have one datapoint containing a pretty large number (the date). You could pretty easily create three complex datapoints containing the year, month, and date as separate numbers, then display those three numbers in a single big number widget.

1 minute ago, Stuart Weenig said:

There's no way to apply formatting. However, you have one datapoint containing a pretty large number (the date). You could pretty easily create three complex datapoints containing the year, month, and date as separate numbers, then display those three numbers in a single big number widget.

Oh really??  I assumed since this one value is associated with 1 OID that I'd have to treat it as one big value...

That's sort of right. Since the data is in one OID, it's easiest to pull it back with that one OID. But complex datapoints are designed to allow you to manipulate the data after it's pulled back. You can do a huge range of mathematical and logical operators on the standard datapoint. https://www.logicmonitor.com/support/logicmodules/datasources/datapoints/complex-datapoints

1 hour ago, Stuart Weenig said:

That's sort of right. Since the data is in one OID, it's easiest to pull it back with that one OID. But complex datapoints are designed to allow you to manipulate the data after it's pulled back. You can do a huge range of mathematical and logical operators on the standard datapoint. https://www.logicmonitor.com/support/logicmodules/datasources/datapoints/complex-datapoints

Thanks for this! I have to admit I'm 100% lost on Infix and RPN both. I've never seen either but I'm trying to research now.

1 hour ago, Stuart Weenig said:

That's sort of right. Since the data is in one OID, it's easiest to pull it back with that one OID. But complex datapoints are designed to allow you to manipulate the data after it's pulled back. You can do a huge range of mathematical and logical operators on the standard datapoint. https://www.logicmonitor.com/support/logicmodules/datasources/datapoints/complex-datapoints

So, Why these options only? Infix, RPN or groovy?  I can't find much on the first two that's *not* just working with mathematical equations. Definitely having a super hard time finding anything useful.

They are what they are. The support page linked should give you what you need. 

For example, to get the day from the value 20221231, if the normal datapoint is called myvalue, you'd do this:

myvalue % 100

To get the month, you'd do:

floor(myvalue / 100) % 100

To get the year, you'd do:

floor(myvalue / 10000)

1 hour ago, Stuart Weenig said:

They are what they are. The support page linked should give you what you need. 

For example, to get the day from the value 20221231, if the normal datapoint is called myvalue, you'd do this:

myvalue % 100

To get the month, you'd do:

floor(myvalue / 100) % 100

To get the year, you'd do:

floor(myvalue / 10000)

You've obviously been working with those for a while :)

So, logically that makes no sense to me what so ever...

Also, what is 'myfloor' and what does it mean?  I think FoxPro might be easier to understand than this! lol


I definitely appreciate your help on this issue, even though Im as confused as a fart in a fan factory.

floor() is a function that rounds down whatever is in the parenthesis to the nearest integer. If myvalue is the name of your standard datapoint, then floor(myvalue) would round the standard datapoint down to the nearest integer.

The mod operator (%) returns the remainder after division. So if you take 20221231 and divide by 100, you get 202212 with a remainder of 31. The mod (%) just grabs the 31. 

Each complex datapoint is just another column in the raw data table.

If you're still confused, i recommend coming to one of our live webinars.

Thanks Stuart, especially for the webinar link. I will be checking that out.

Userlevel 1
Badge +6

For what it’s worth, I believe the way our team tends to represent these sorts of things (expiration dates) is to create a datapoint which calculates the number of days until expiration. You’d probably want to use a groovy complex datapoint (although it might be possible with a regular one) to take the value, use a date conversion function to make it a date, then use more date math to subtract the current date from the expiration to get a count of days. This won’t give you the exact display you want, but you can put up a big “X days until license expiration” widget and watch it count down. You can also put alert thresholds like “< 31 7 2” on the datapoint to give you a warning when it’s a month out, an error when it’s a week out, and a critical 2 days before expiration. 

https://www.logicmonitor.com/support/logicmodules/datasources/datapoints/complex-datapoints#

https://opensource.com/article/21/8/groovy-date-time


Reply