 Employee
Using LogicMonitor's REST API as a Power BI Source
Overview
LogicMonitor has a number of built-in report types that can be customized and sent out on a scheduled basis, including the powerful ability to turn any dashboard into a dynamic report. A common question for cloud-based services like LogicMonitor, however, is how to incorporate hosted data with information from other sources. An example may be a report that combines inventory data & monitoring metrics from LogicMonitor with incident data from systems such as ServiceNow.
With Microsoft Power BI’s ability to easily parse and ingest JSON data directly from web services, it’s possible to create reports directly from LogicMonitor’s REST-based APIs without the need for intermediary automation or databases.
Below are some basic steps to start pulling data directly from your LogicMonitor portal into a Power BI report. This isn’t meant to be a comprehensive reference though the concepts introduced here can be used for other report types generated directly from LogicMonitor data.
Prerequisites
-
The Microsoft Power BI Desktop software and knowledge of its usage for building reports. If needed, the software can be downloaded from the following link:
https://www.microsoft.com/en-us/download/details.aspx?id=58494 - A login for your LogicMonitor portal that has at least read-only permissions for the information to be included on the report.
-
Basic familiarity with LogicMonitor’s REST APIs. The full API reference can be found at:
https://www.logicmonitor.com/support/rest-api-developers-guide/overview/using-logicmonitors-rest-api
Adding a LogicMonitor REST API as a Power BI Source
For this example we will use LogicMonitor's "Get Devices" API method to build a simple inventory report. Documentation for the "Get Devices" method and its options are available at:
https://www.logicmonitor.com/support/rest-api-developers-guide/v1/devices/get-devices
1. Launch Microsoft Power BI Desktop.
2. Click the Get Data button, either on the intro dialog or on the toolbar ribbon.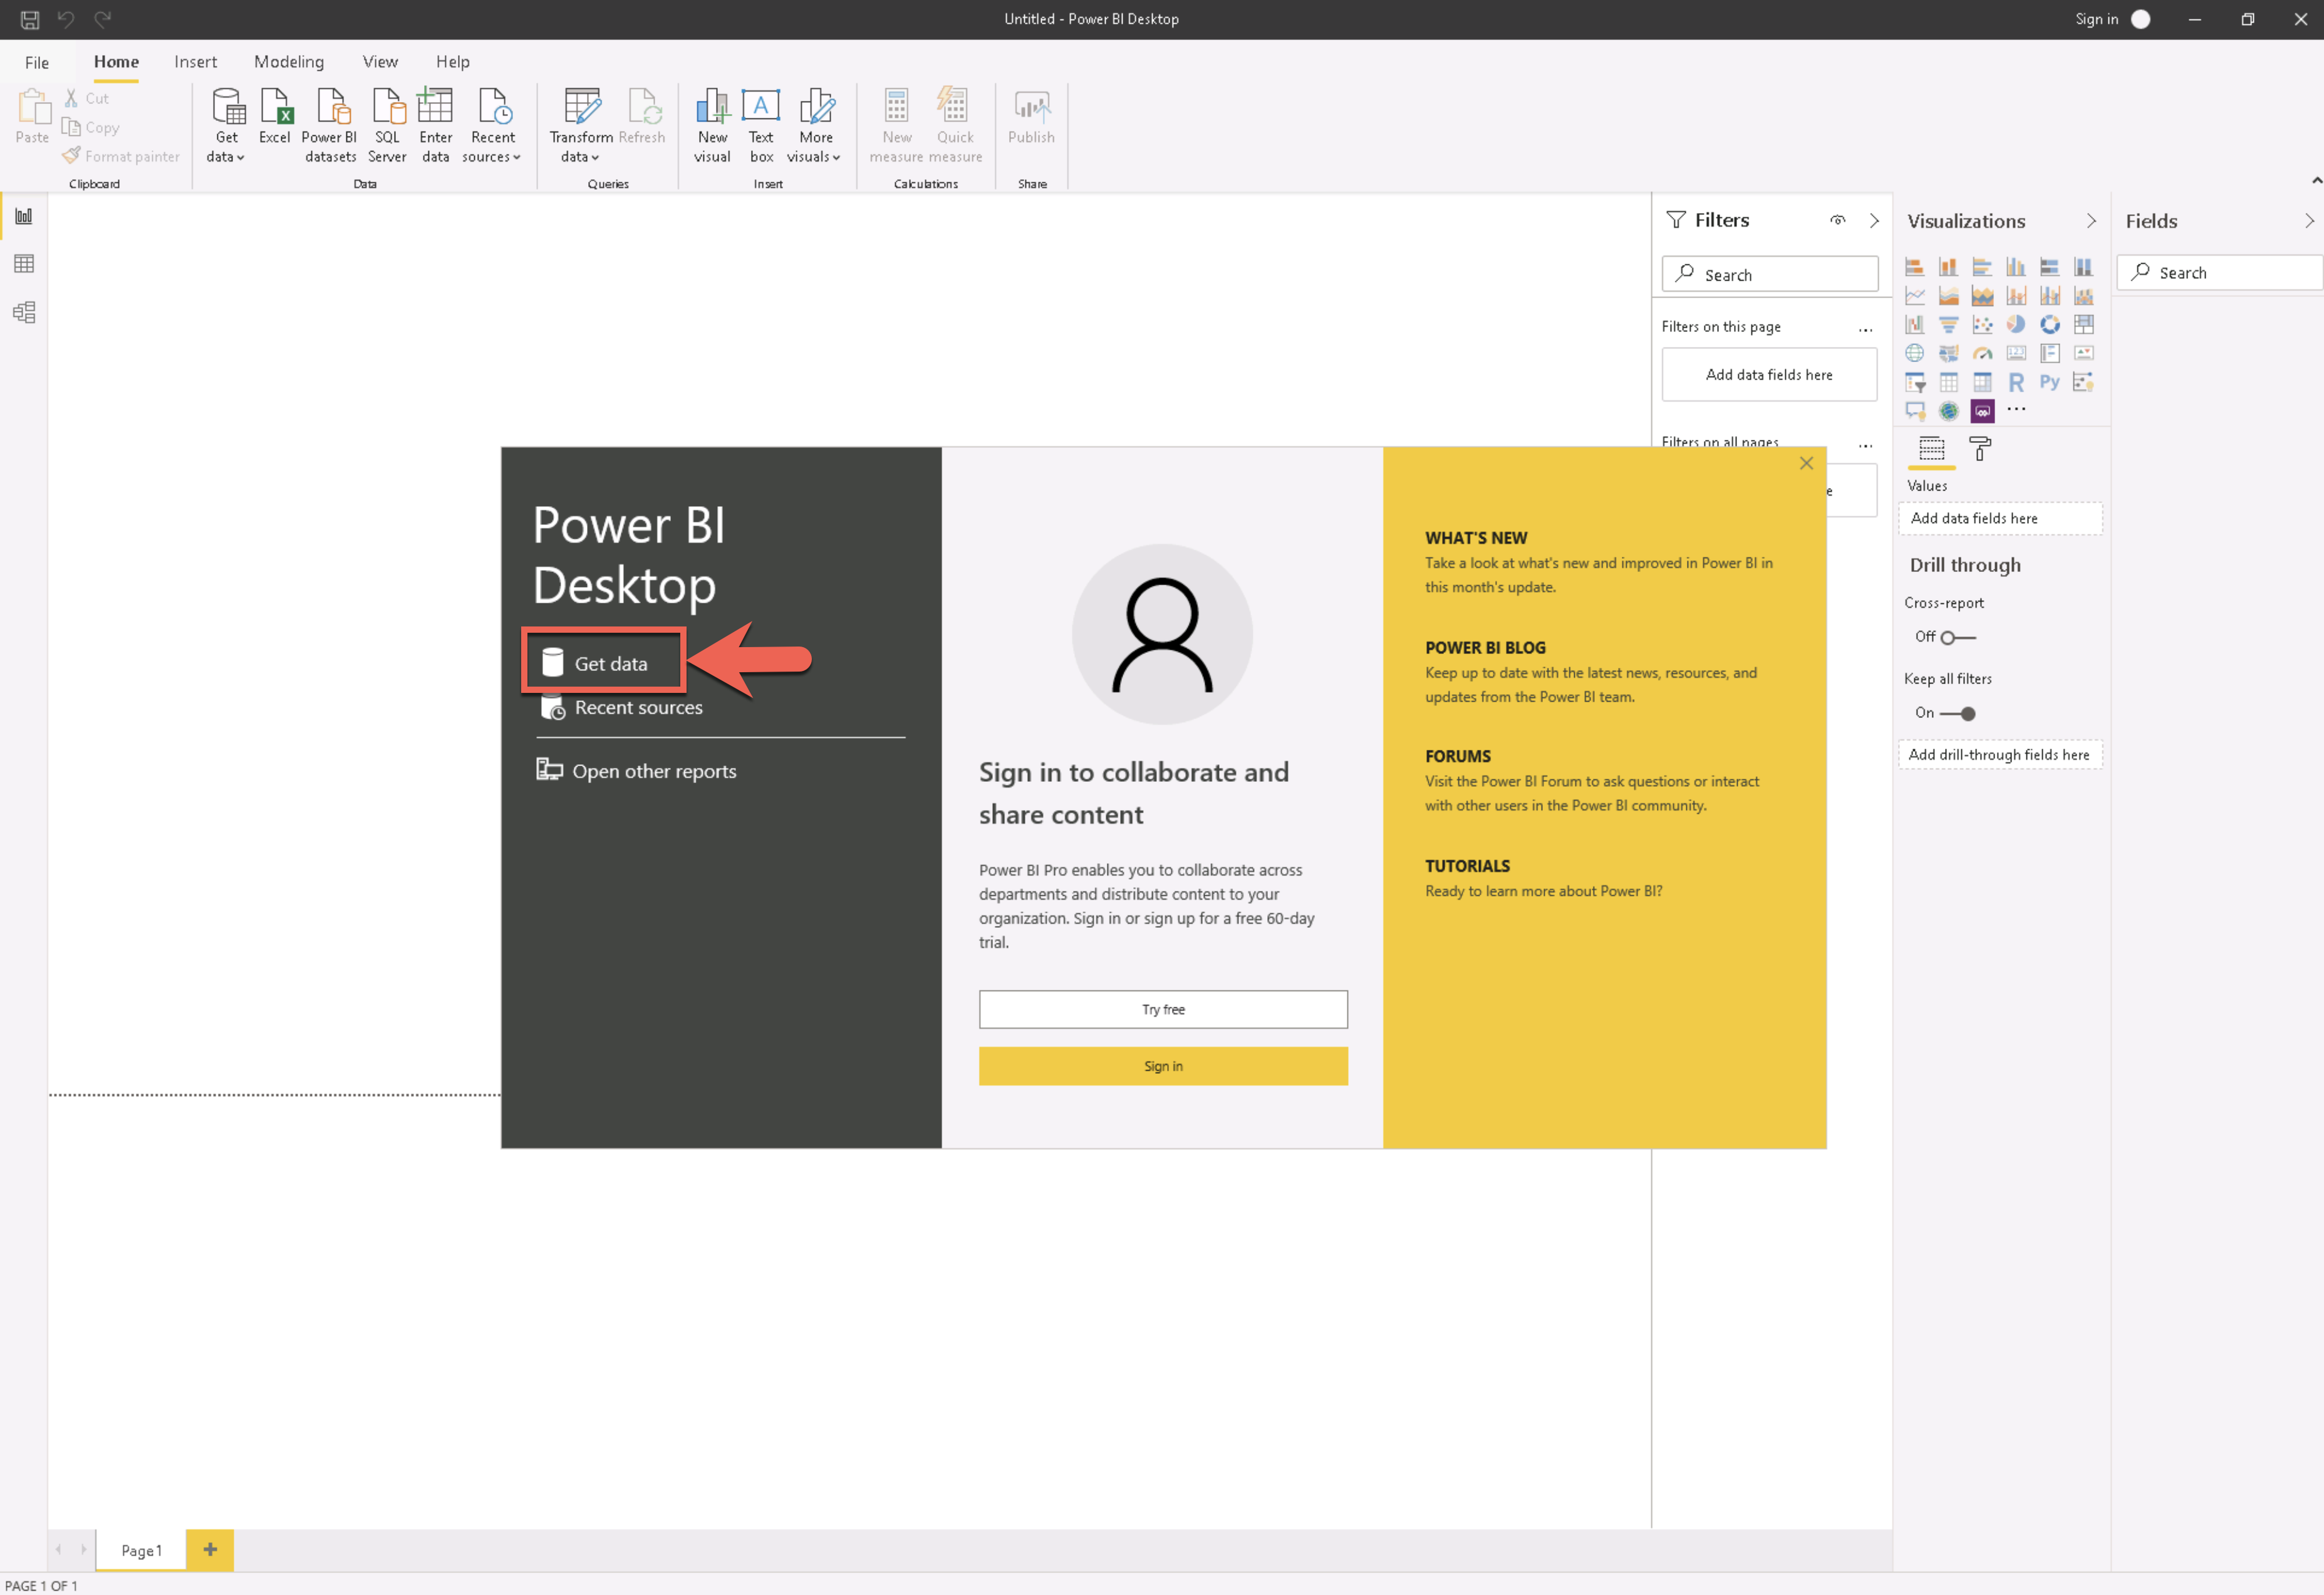
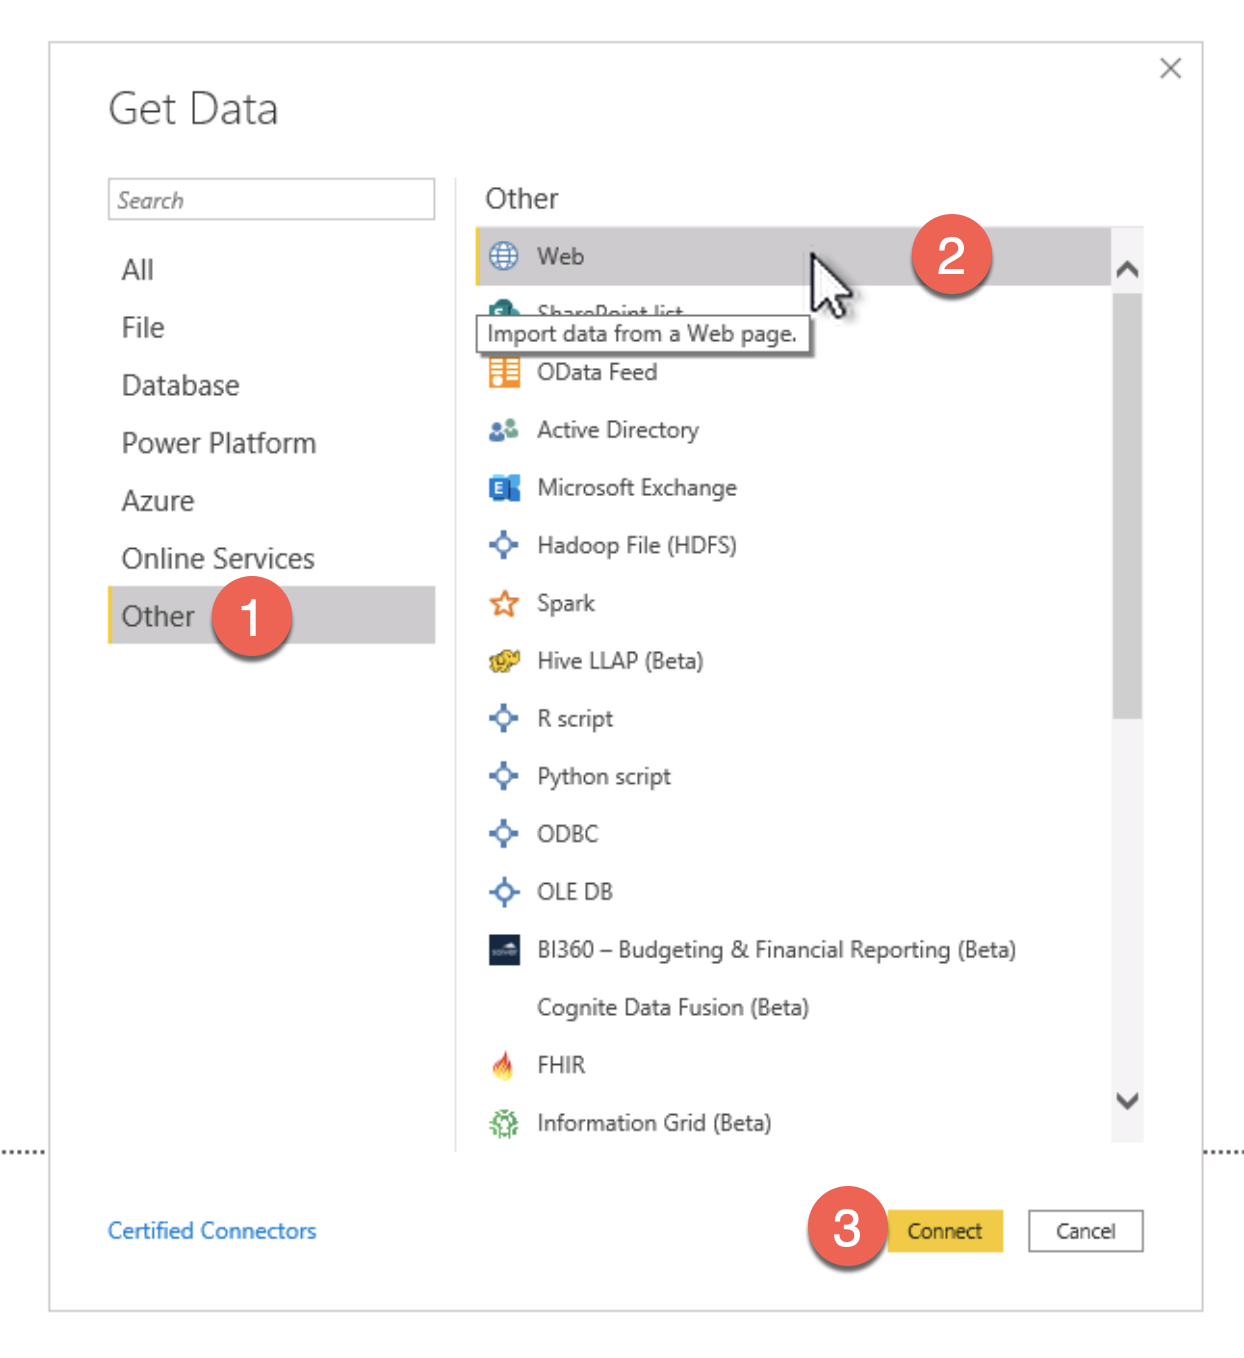
3. On the Get Data dialog, search for the “Web” data type that’s located under the “Other” section. Once “Web” is selected click the Connect button.
4. Enter the URL of the REST method, including optional query parameters. For the example using the "Get Devices" method, the URL used was the following (replace "[portalname]" to match your own LogicMonitor portal's URL) :
https://[portalname].logicmonitor.com/santaba/rest/device/devices?size=1000&fields=alertStatus,autoProperties,displayName,description,id,link,hostStatus,name,systemProperties,upTimeInSeconds
This example URL calls the "Get Devices" method (/device/devices) and passes optional parameters specifying to return up to 1,000 records and lists some properties/fields we want for each device.
Please refer to the “Get Devices” method’s documentation for more information about the available parameters and options. For instance, if your query has more than 1,000 results available (the maximum results available in a single REST call) then you may have to code a loop in Power BI to make multiple calls that paginate through the available results.
5. Power BI will then try to access that URL. After a moment it will ask how to authenticate with the REST service. For this example we’ll use the Basic authentication method. Enter a valid LogicMonitor username and password that Power BI will use to access your portal’s web services and click the Connect button.
(NOTE: as mentioned in LogicMonitor’s REST documentation, the option for “Basic” authentication may be removed at some point in the future.)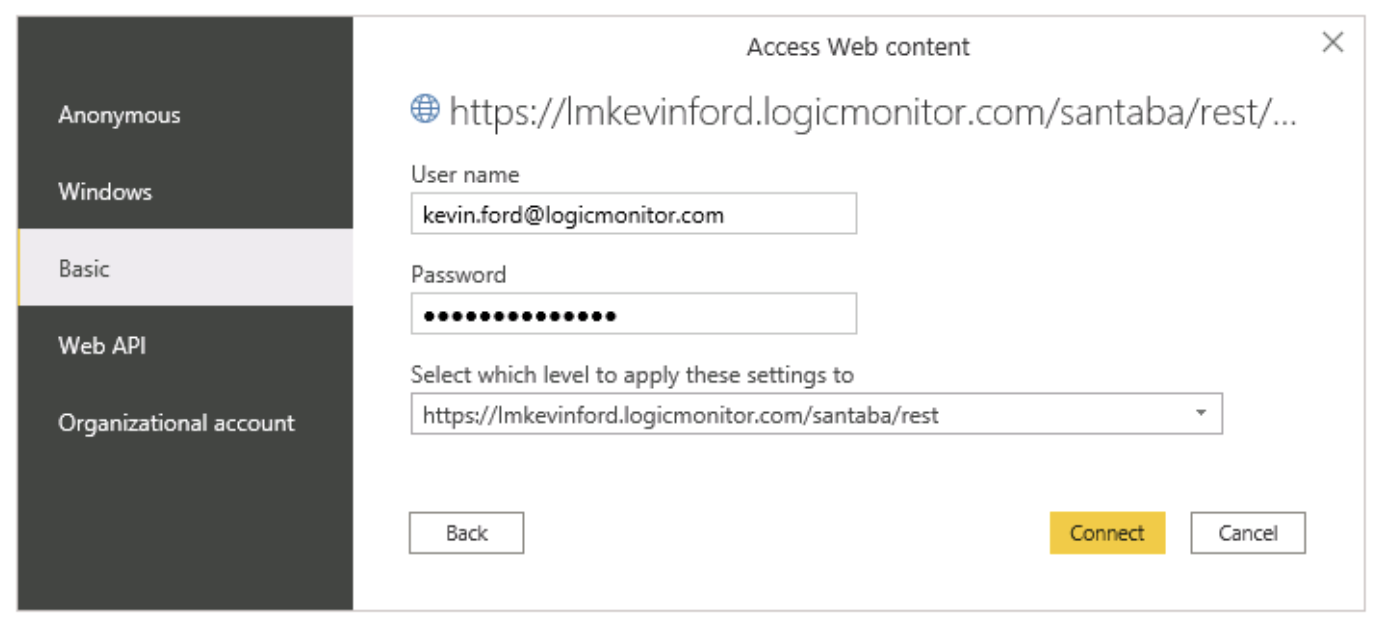
6. Power BI will then authenticate with LogicMonitor's REST service. After a moment you'll see the initial results from your REST query.
Click the "Record" link on the result's 'data' row.
7. Next, click the "List" link on the 'items' row to expand the list of records.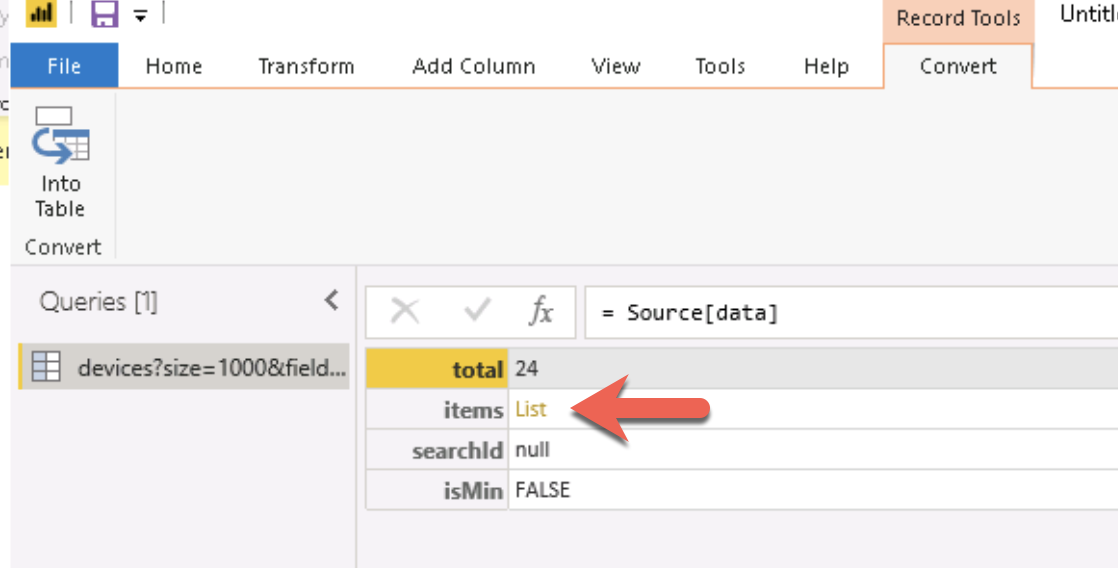
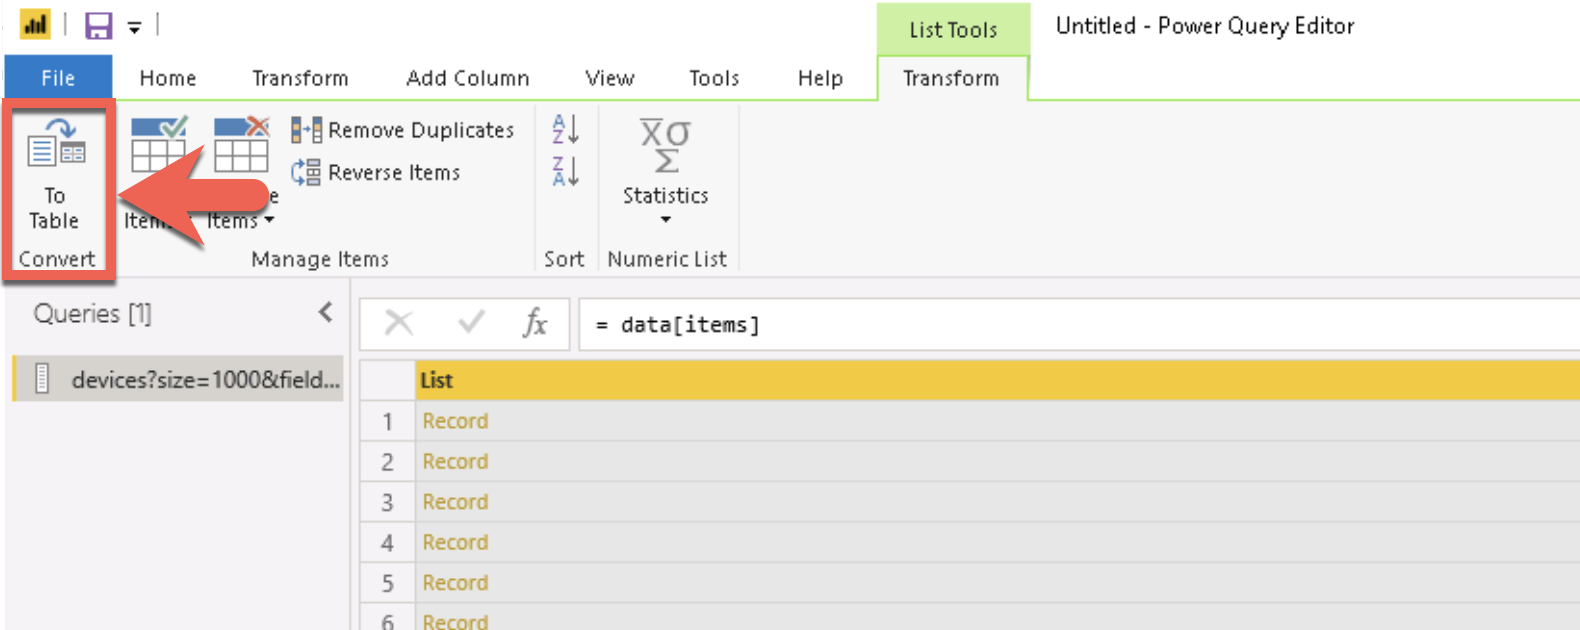
9. Keep the default conversion options and click OK.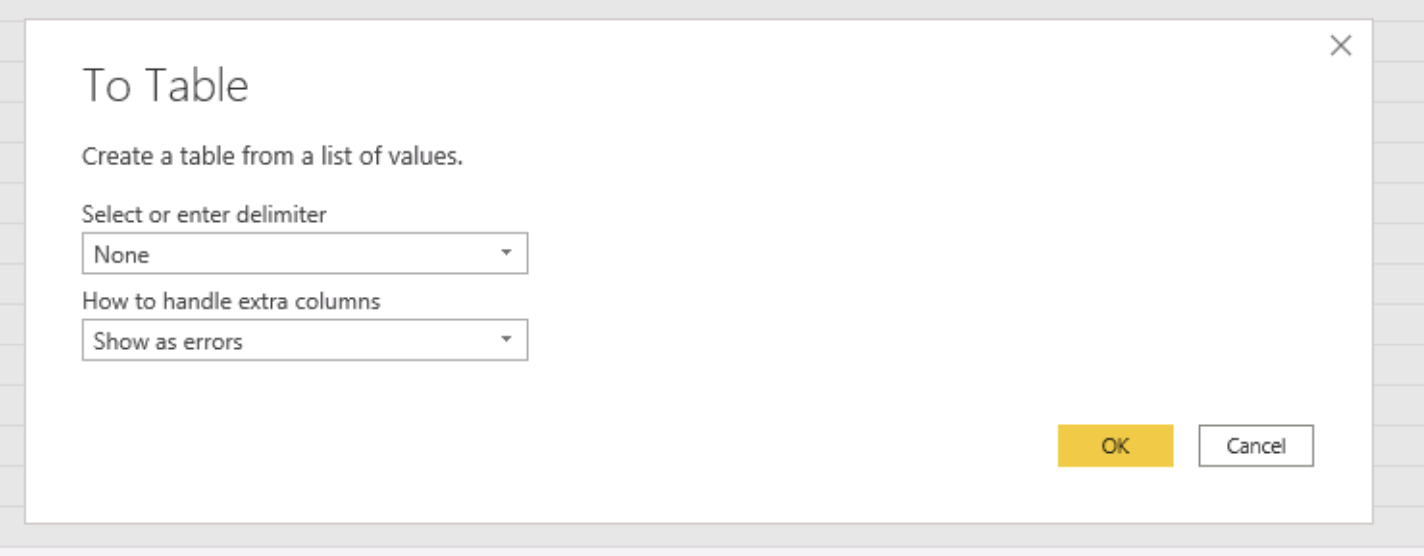
10. Click the small icon in the column header to expand the results.
11. Click OK on the column selection dialog.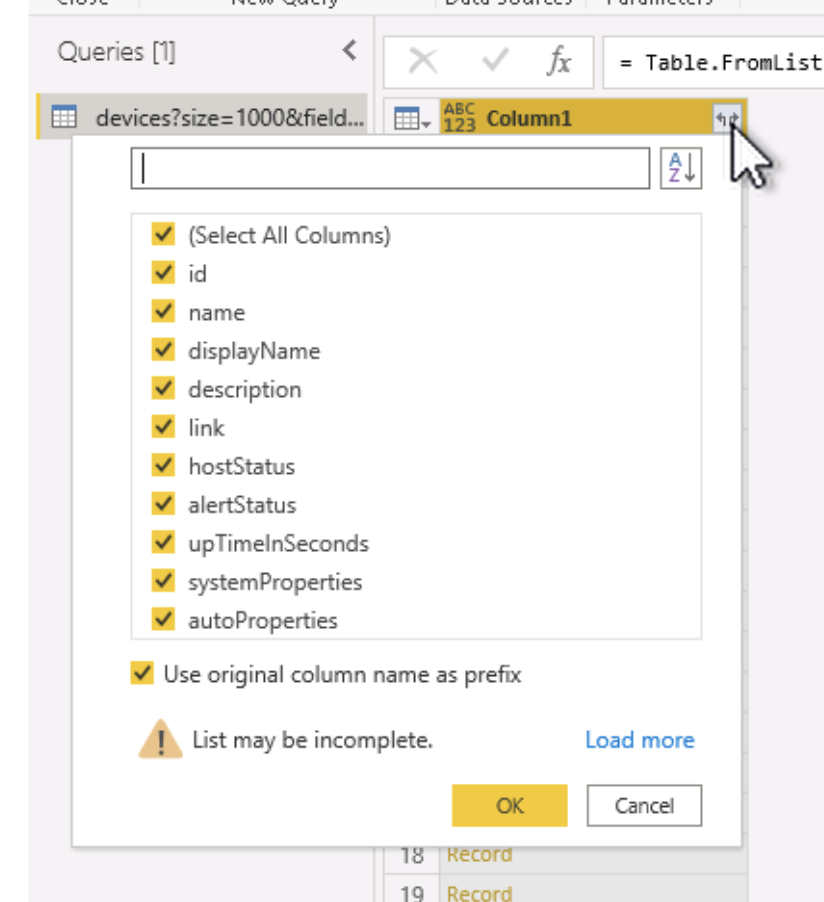
12. Click the Close & Apply button to apply the changes from the query builder.
You've now added the REST method as a dynamic data source in Power BI. At this point you can design the report to suit your specific needs.
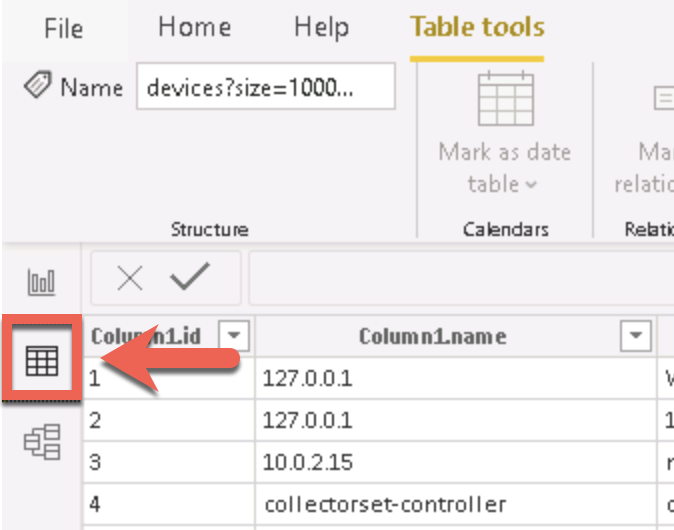
If you want to browse and manipulate the data that was brought into the model, click the Data button (looks like a small grid) on the left-hand toolbar.
