 Employee
Using LogicMonitor's REST API as a Power BI Source - Part 2
Overview
Back in 2020 I shared an article on how to use any of LogicMonitor's REST API methods as a datasource in Power BI Desktop for reporting. That opened a good deal of potential but also had some limitations; in particular, it relied on use of basic authentication that will eventually be deprecated, and it could only make a single API call so could only fetch up to 1,000 records. I've documented how to use a LogicMonitor bearer token instead of basic authentication, but bearer tokens aren't currently available in every portal (just our APM customers for now) and it still faces the single call limitation.
In lieu of a formal Power BI data connector for LogicMonitor being available yet, there is another option available that is more secure and a good deal more flexible: using Microsoft Power BI Desktop's native support for Python!
Folks familiar with LogicMonitor's APIs know there is a wealth of example Python scripts for many of our REST methods (example). These scripts not only allow us to leverage accepted methods of authentication but also allow combining calls and tweaking results in various ways that can be very useful for reporting. Best of all, using these scripts inside Power BI isn't difficult and can even be used for templated reports (I'll include some working examples at the end of this article).
While these instructions focus on Power BI Desktop, reports leveraging Python can also be published to the Power BI service (Microsoft article for reference).
Prerequisites
- Power BI Desktop. You can install this via Microsoft's Store app or from the following link: https://www.microsoft.com/en-us/download/details.aspx?id=58494
- The latest version of Python installed on the same system as Power BI Desktop. This can also be installed via Microsoft's Store app or from: https://www.python.org/downloads/windows/
- Some basic familiarity with LogicMonitor’s REST APIs, though I'll provide working examples here to get you started. The full API reference can be found at:
https://www.logicmonitor.com/support/rest-api-developers-guide/overview/using-logicmonitors-rest-api
First, install Power BI Desktop and Python, then configure each according to this Microsoft article: https://learn.microsoft.com/en-us/power-bi/connect-data/desktop-python-scripts. When adding the Python modules, you'll also want to add the 'requests' module by running:
pip install requestsModifying Python Scripts for Use in Power BI
As mentioned in the Microsoft article above, Power BI will expect Python scripts to use the Pandas module for output. If you're not familiar with Pandas, it's used extensively by the data science community for analyzing bulk data. Adding Pandas to one of the example scripts can be as easy as adding 'import pandas as pd' to the list of import statements at top of the script, then converting the JSON returned by LogicMonitor's API to a Pandas dataframe. For example, if the script captured the API results (as JSON) in a variable called "allDevices", we can convert that to a Pandas dataframe as simply as something like: pandasDevices = pd.json_normalize(allDevices)
In that example, "pd" is the name we gave to the Pandas modules back in the "import" statement we added, and "json_normalize(allDevices)" tells Pandas to take our JSON and convert it to a Pandas dataframe. We can then simply print that variable as our output for Power BI Desktop to use as reporting data.
Below is a full Python script that fetches all the devices from your portal and prints it as a Pandas dataframe. This is just a minor variation of an example given in our support documentation. You'd just need to enter your own LogicMonitor API ID, key, and portal name in the variables near the top.
#!/bin/env python

import requests
import json
import hashlib
import base64
import time
import hmac
# Pandas is required for PowerBI integration...
import pandas as pd

# Account Info...
# Your LogicMonitor portal's API access ID...
AccessId = 'REPLACE_WITH_YOUR_LM_ACCESS_ID'
# Your LogicMonitor portal's API access Key...
AccessKey = 'REPLACE_WITH_YOUR_LM_ACCESS_KEY'
# Your LogicMonitor portal. Example: if you access your portal at https://xyz.logicmonitor.com, then your portal name is "xyz"...
Company = 'REPLACE_WITH_YOUR_LM_PORTAL_NAME'

# Create list to keep devices...
allDevices = []

# Loop through getting all devices...
count = 0
done = 0
while done==0:
	# Request Info...
	httpVerb ='GET'
	resourcePath = '/device/devices'
	data=''
	# The following query filters for just standard on-prem resources (deviceType=0), so adjust to suite your needs...
	queryParams ='?v=3&offset='+str(count)+'&size=1000&fields=alertStatus,displayName,description,deviceType,id,link,hostStatus,name&filter=deviceType:0'

	# Construct URL...
	url = 'https://'+ Company +'.logicmonitor.com/santaba/rest' + resourcePath + queryParams

	# Get current time in milliseconds...
	epoch = str(int(time.time() * 1000))

	# Concatenate Request details...
	requestVars = httpVerb + epoch + data + resourcePath

	# Construct signature...
	hmac1 = hmac.new(AccessKey.encode(),msg=requestVars.encode(),digestmod=hashlib.sha256).hexdigest()
	signature = base64.b64encode(hmac1.encode())

	# Construct headers...
	auth = 'LMv1 ' + AccessId + ':' + signature.decode() + ':' + epoch
	headers = {'Content-Type':'application/json','Authorization':auth}

	# Make request...
	response = requests.get(url, data=data, headers=headers)

	# Parse response & total devices returned...
	parsed = json.loads(response.content)
	total = parsed['total']
	devices = parsed['items']
	allDevices.append(devices)
	numDevices = len(devices)
	count += numDevices
	if count == total:
		print ("done")
		done = 1
	else:
		print ("iterating again")

# (for debugging) Print all devices...
# print (json.dumps(allDevices, indent=5, sort_keys=True))

# Grab just the data items...
items = allDevices[0]

# Convert the JSON to a Panda dataframe that PowerBI can consume...
resources = pd.json_normalize(items)
# Print the dataframe...
print (resources)
If you run that Python script directly, you'll see it prints in a columnar format instead of the raw JSON returned by the API. It's a good example of how Pandas converted the raw data into a more formal data structure for manipulation & analysis. Power BI Desktop leverages that data directly for ingestion into its own reporting engine, which is a pretty powerful combination.
Now let's show how to put it to use!
How to create a Power BI report that pulls data directly from LogicMonitor via Python
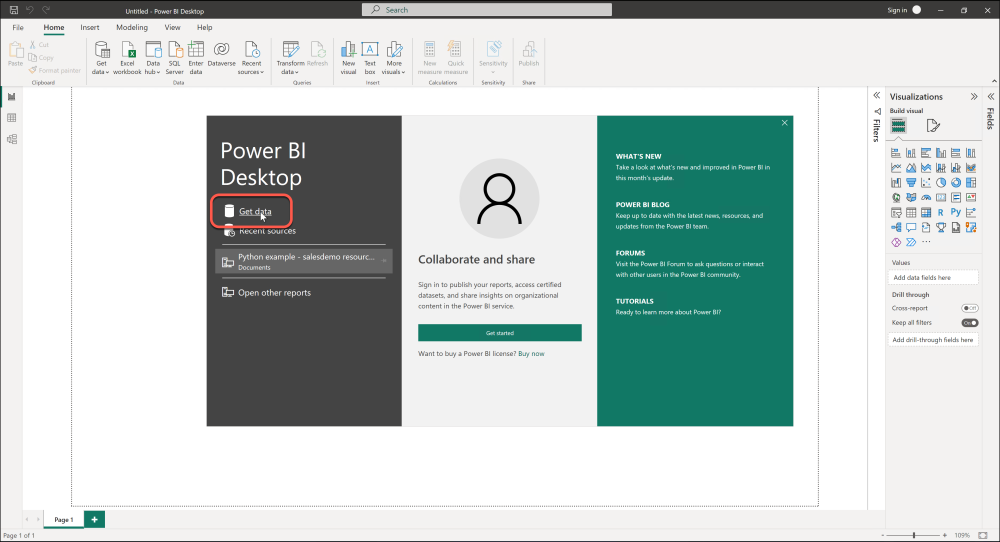
- In Power BI Desktop, click the Get Data button. This can be to start a new report or to add to an existing report.
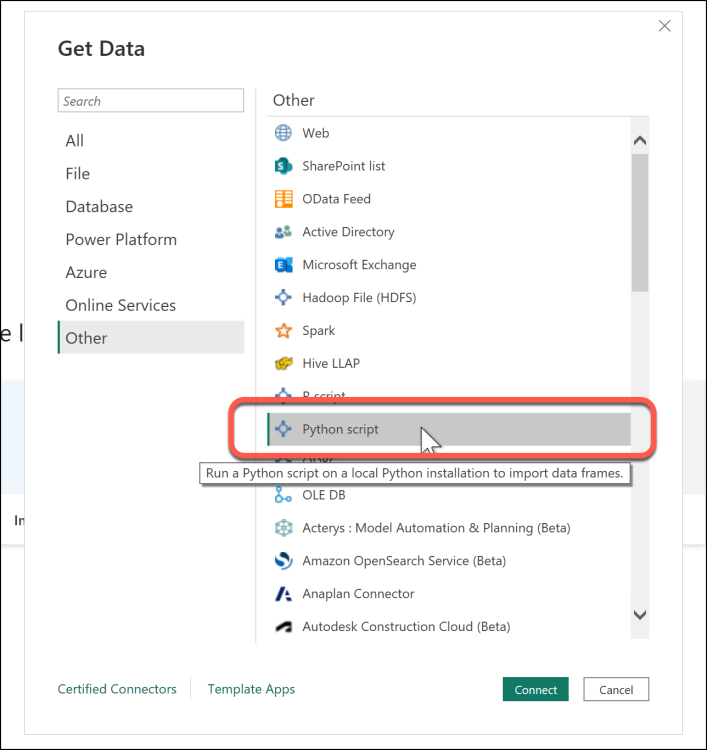
- Choose to get data from an "Other" source, choose "Python script", then click the Connect button.
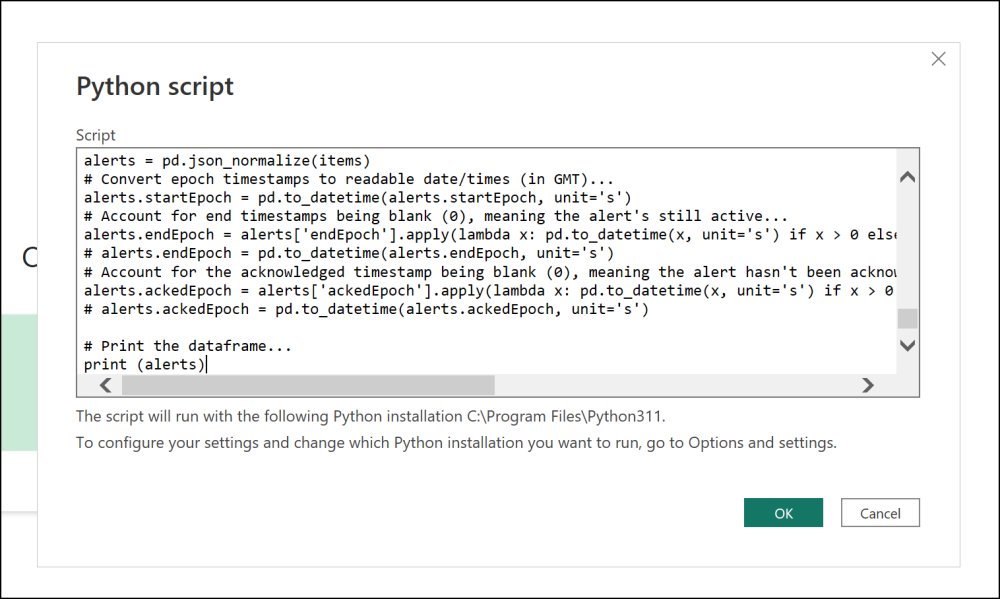
- Paste in your complete and working Python script, then click OK. (some examples are attached to the bottom of this article)
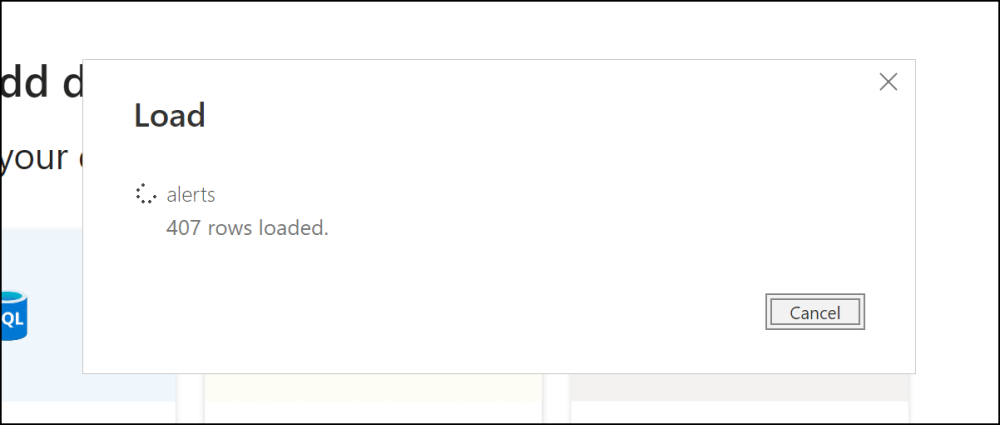
- Power BI will run the script. Depending on the amount of data being retrieved this can take anywhere from a few seconds to a few minutes.
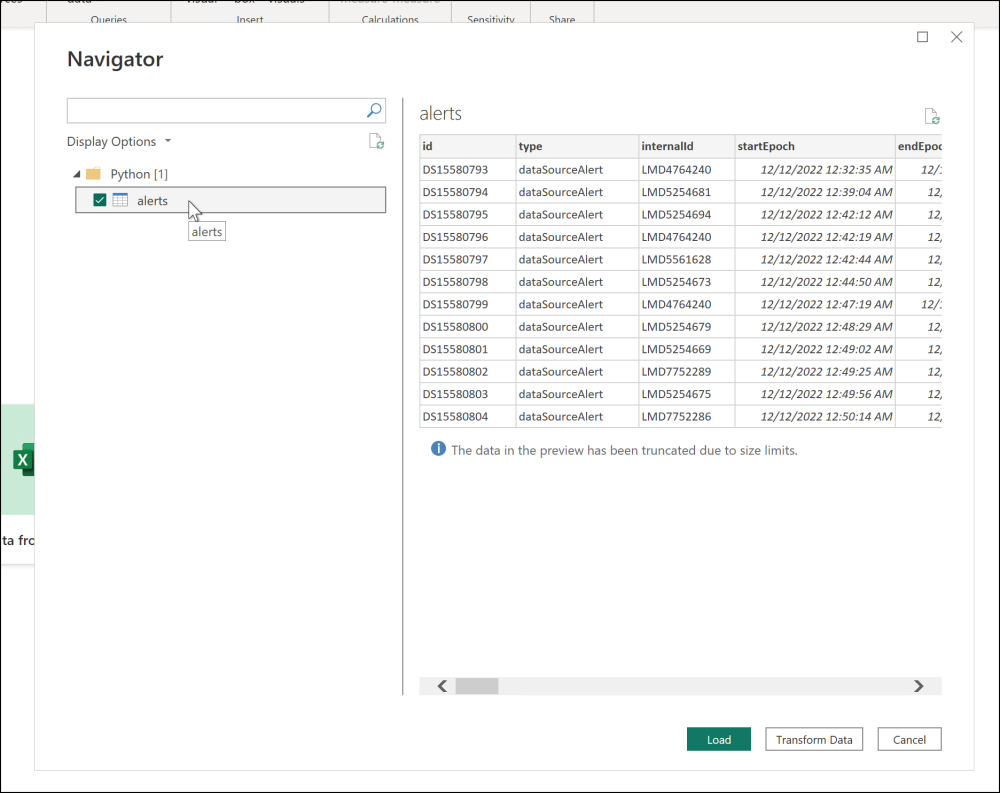
- When it's complete, you'll see the Navigator pane with the name of the Python Pandas dataframe from the script output. Check the box next to the item to see the data preview. If the sample looks good then click the Load button.
- After Power BI has loaded the data you'll be presented with the report designer, ready for you to create your report. To see the full preview of the data from your portal, click the Data icon to the left of the report workspace.
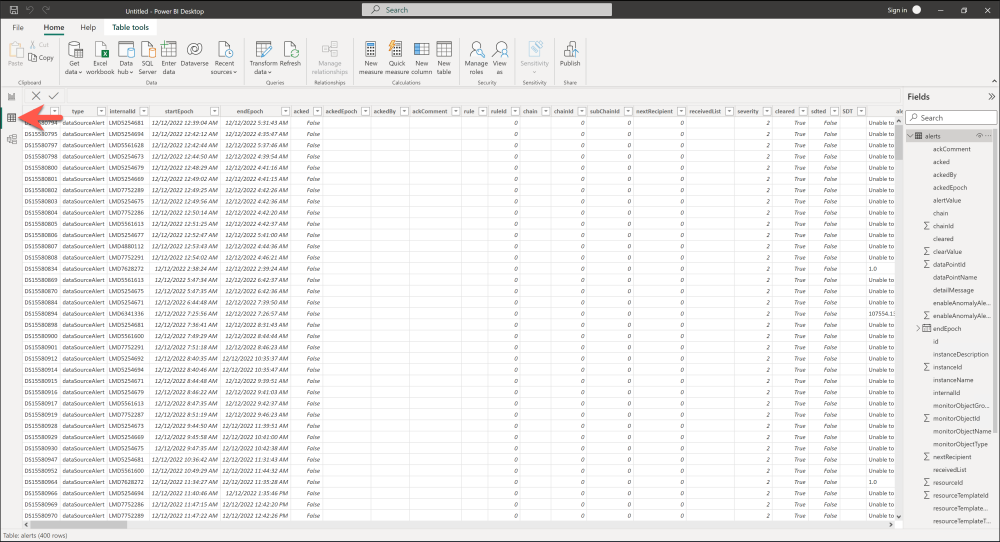
When you need to pull the latest data from LogicMonitor, just click the Refresh button in the toolbar.

To Convert a Report to a Parameterized Template
If you've created a Python-based report and want to save it as a re-useable, parameterized template, we'll first need to add our necessary parameters and enable Power BI to pass those values to the script.
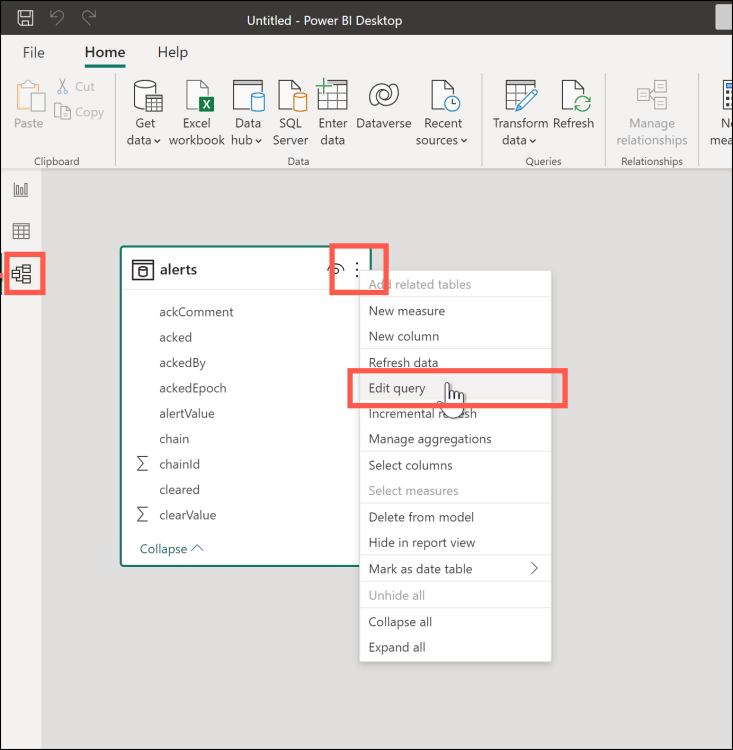
- With the report active that we want to turn into a template, click the Model icon to the left of the workspace. From there, click the three dots in the upper-right corner of the table generated by the Python script and choose Edit Query.
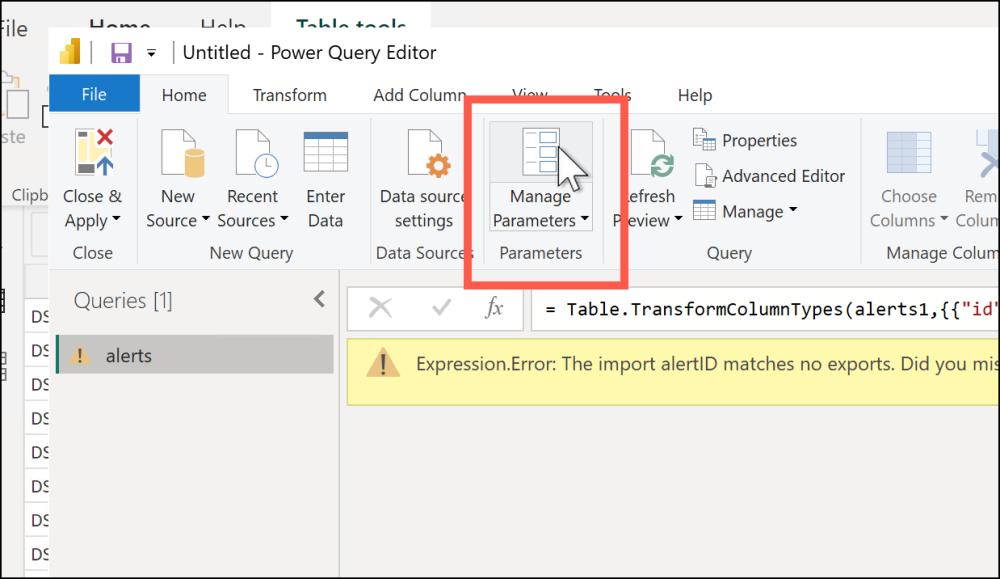
- That will open the Power Query Editor. From here click Manage Parameters on the toolbar.
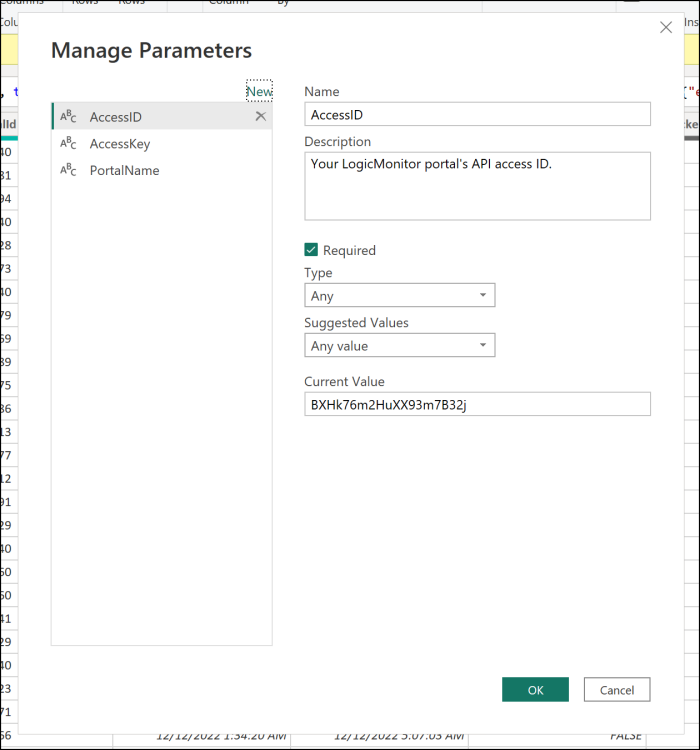
- For our example we'll add three new parameters, which we'll call "AlertID", "AlertKey" & "PortalName" (feel free to label them however you choose). For each, enter the respective criterion used for accessing your LogicMonitor API in the Current Value field. Below's an example of what it would look like when completed. When done click the OK button to close the dialog.
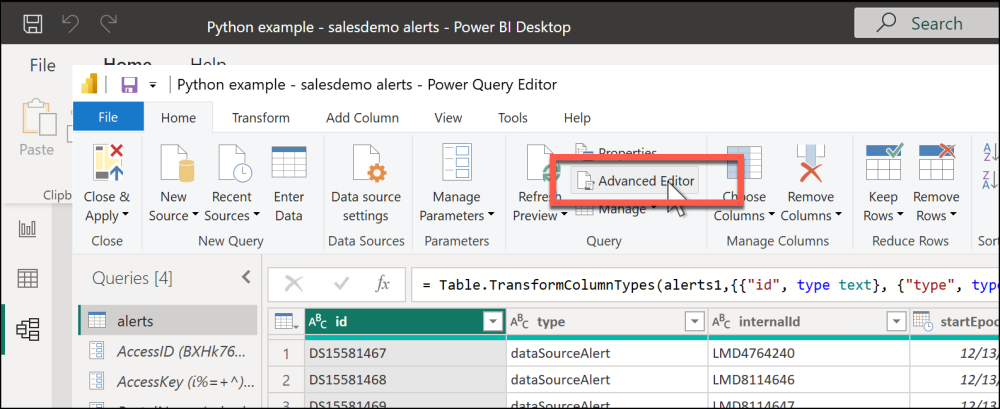
- Next, click the table name in the Queries list ("alerts" in our example screenshot) and click the Advanced Editor option in the toolbar.
- You'll see Power BI’s M language query for our datasource, including the Python script embedded in it. We're going to edit the script to replace the hard-coded API parameters to use the Power BI parameters we defined instead. Replace the values of the script's AccessId, AccessKey, and Company variables with the following, respectively (including the quotes):
" & AccessID & "
" & AccessKey & "
" & PortalName & "
Note that those will be inside the single quotes for each of the variables. Refer to the screenshot below for an example of how it would look (the changes have been highlighted). When ready click the Done button.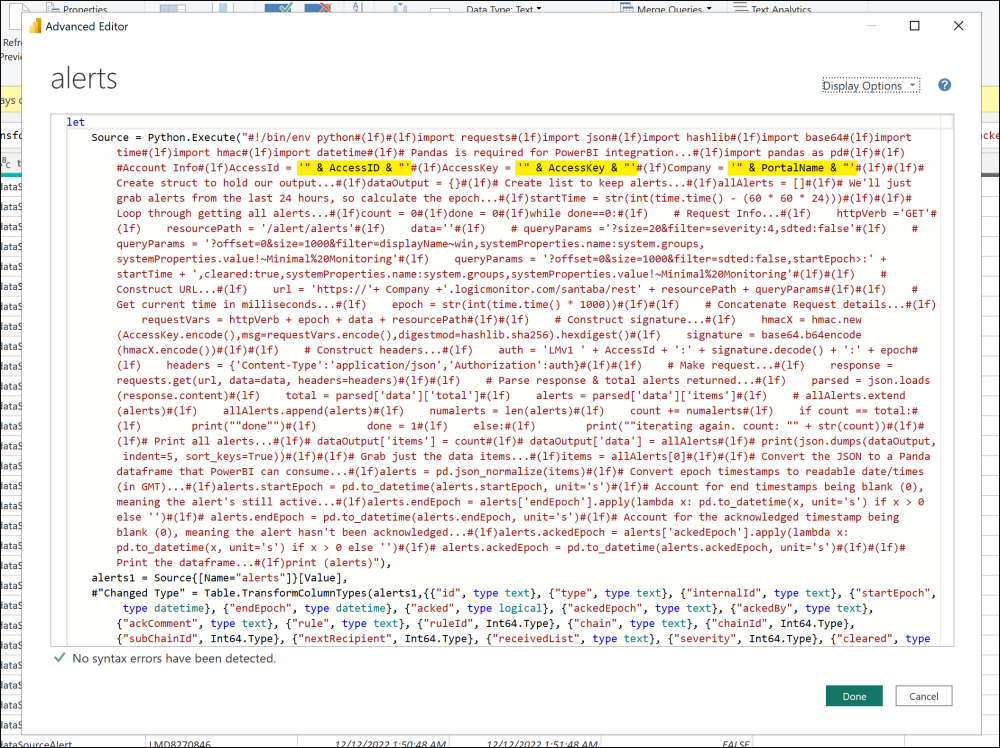
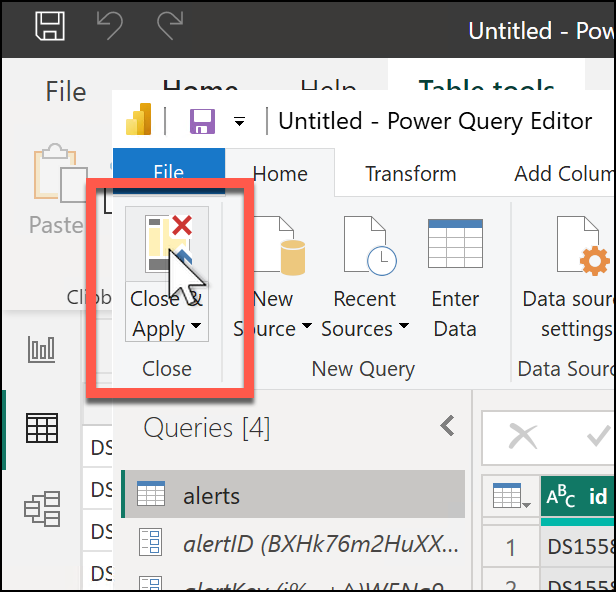
- Click Close & Apply on the Power Query Editor to commit our changes.
- If all looks good, now let's save this as a Power BI template. Click the File menu, then choose Save As. Change the Save As Type to "Power BI template files (*.pbit)", provide a filename and click Save. Power BI will prompt to provide a description for your template. Your report is now ready for sharing!

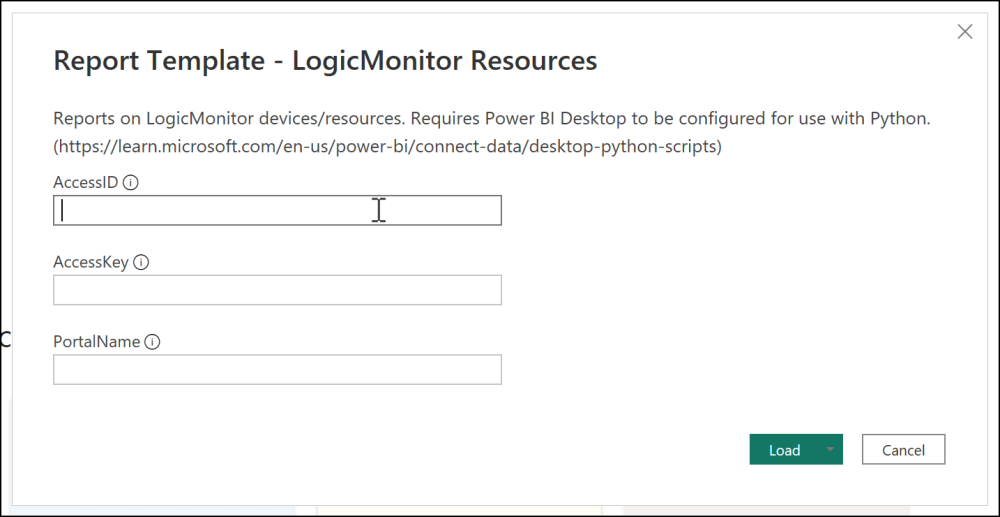
When you open the template file, you'll be prompted to enter values for the parameters we configured in steps 2 & 3. Enter those, hit the Load button, and you'll then be presented with the report designer ready to go.
Example Files
Here are some example Python scripts modified to use Pandas to help get you started:
Here are some basic, ready-to-use Power BI report templates based on the above scripts:
