Employee
Universal 'No Data' monitoring
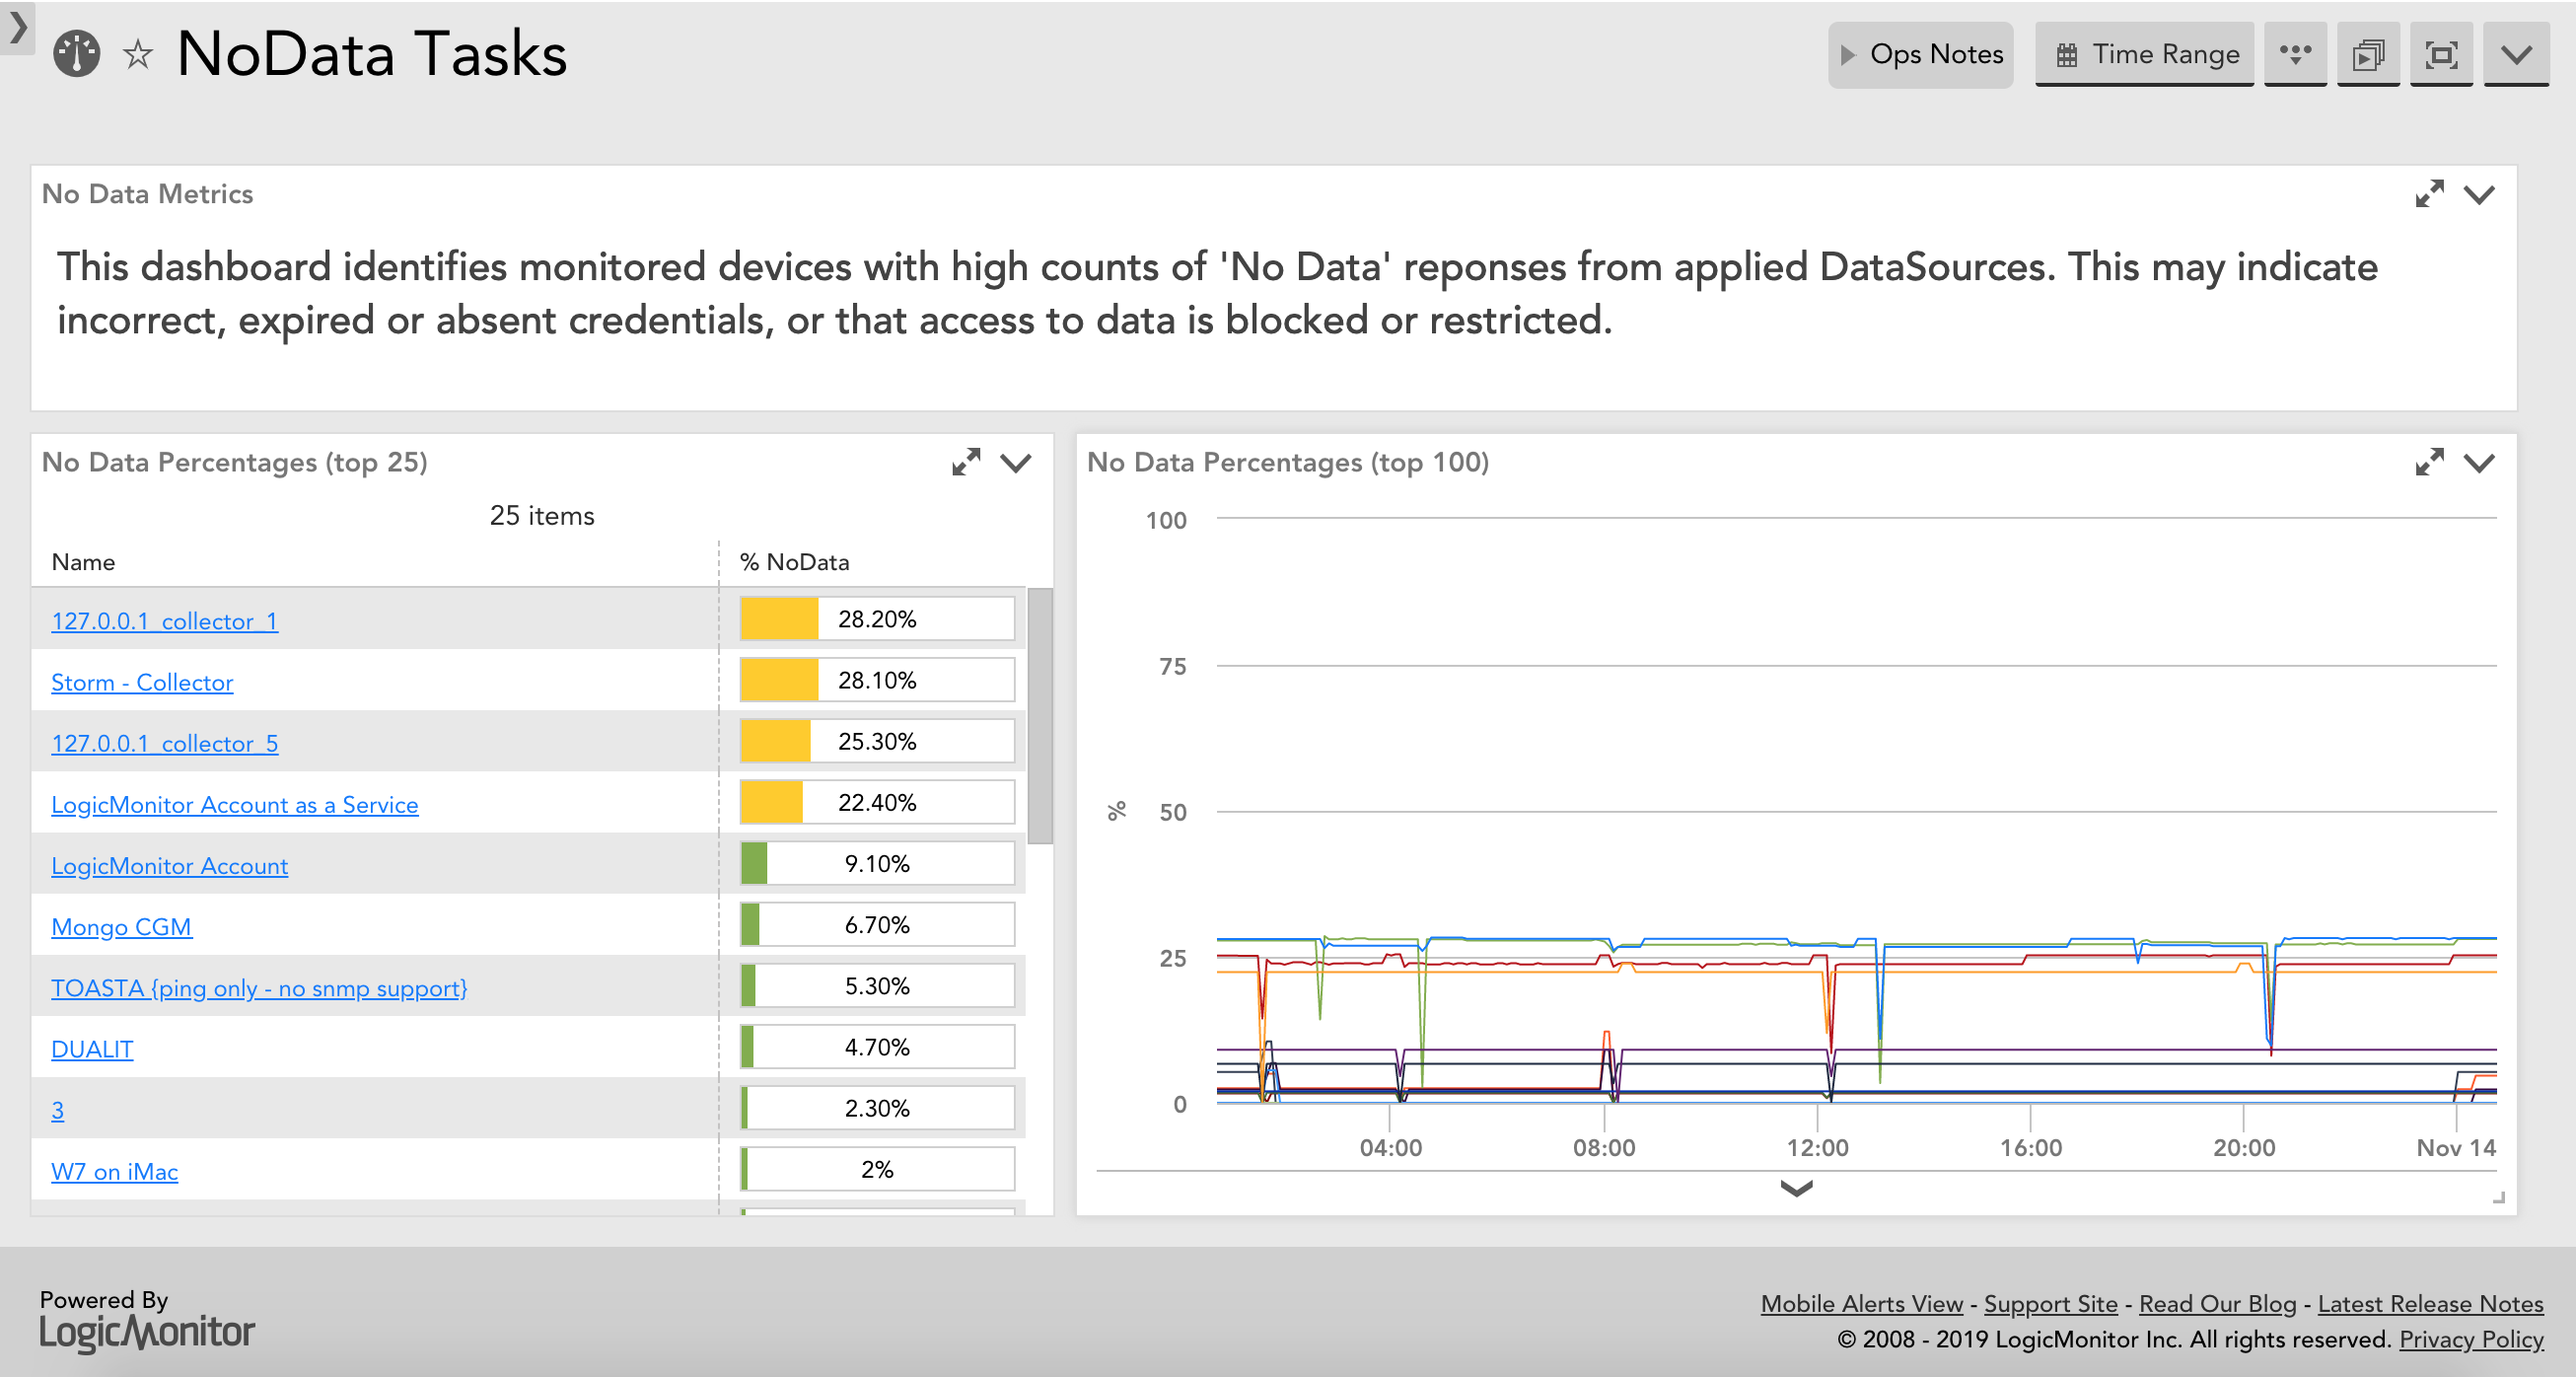
Problem: How do you know how many collection tasks are failing to return data on any given device?
You could set "no data" alerting, but that's fraught with issues. An SNMP community can give access to some parts of the OID tree and not others, so unless you set "no data" alerts on every SNMP metric or DataSource (DO NOT DO THIS!!) you might not see an issue. If you do do this, be prepared for thousands of alerts when SNMP fails on one switch stack...
Here are a suite of three LogicModules that cause the collector to run a '!tlist' (task list) debug command per monitored resource, which produces a summary output of task types being attempted on the resource, counts of those task types, and counts of how many have some or all metrics returning 'NaN' (no data).
As the collector is running the scripts, no credentials are needed.
Unusually, I've used a PropertySource to do the work of Active Discovery, because right now the Groovy import used isn't available in AD scripts and an API call (and therefore credentials) would have been necessary. Additionally, creating a property for instances gives further abilities to the DataSources in terms of comparing what the collection scripts find vs what they were expecting to find, meaning they can "fill in the blanks" and identify a need to re-run Active Discovery.
There are then two DataSources, one returning counts and NaN counts per task type, and the other returning total counts and NaN counts, plus counts of task types not yet discovered by the PropertySource (i.e., Active Discovery is needed - don't worry, that'll sort itself out with the daily Auto Properties run).
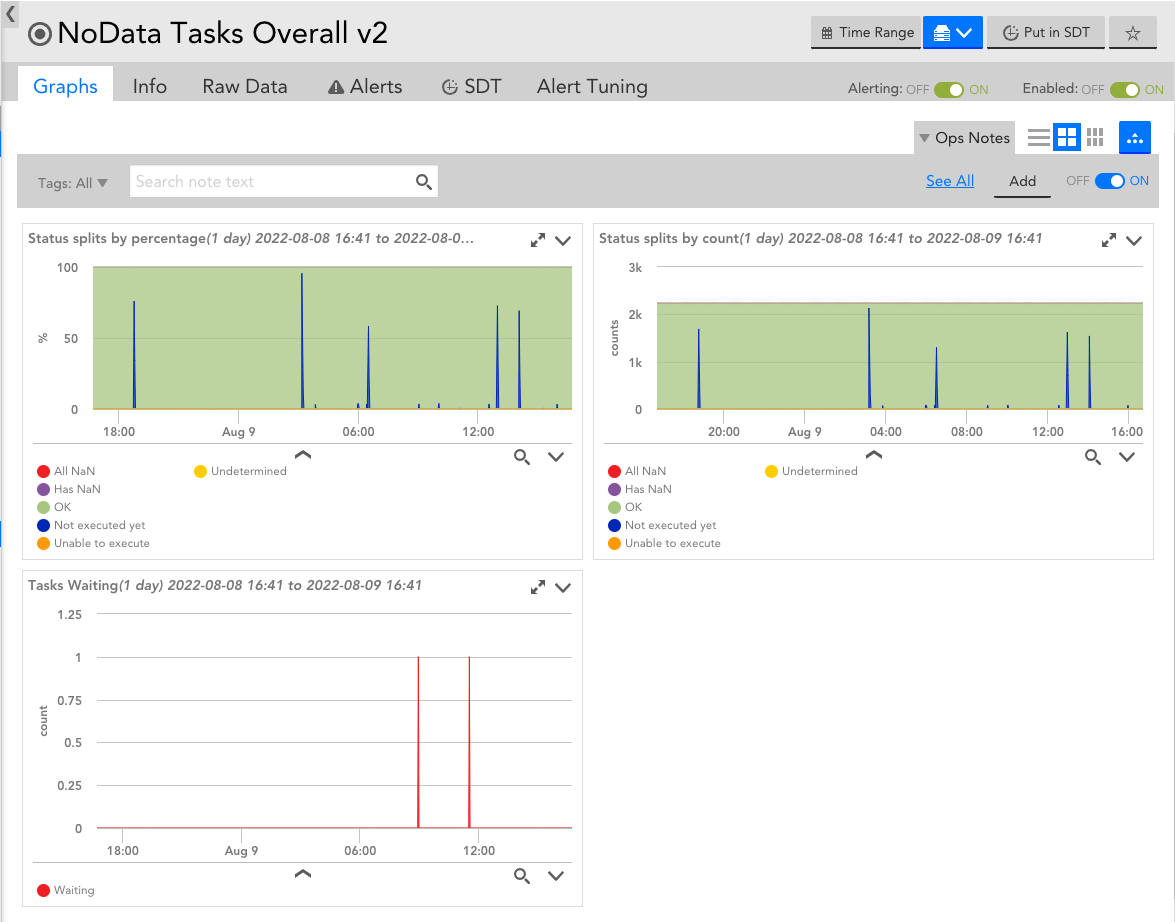
There are no alert thresholds set as presented here, and the reasons are various. Firstly there's no differentiation between tasks that have *some* NaN values and tasks with *all* NaN values. That would demand massively more (unfeasibly more) scripting. Therefore it's a bit fuzzier than just being able to say "Zero is fine, anything else is bad". Secondly, some DataSources sometimes have some NaN values without this indicating any sort of failure. Every environment is different so what we're looking for here is patterns, trends, step changes, that sort of thing - these metrics would be ideal presented in top-N graphs in a dashboard, at least until you get a feel for what's "normal" in your environment. This will help guide you to resources with high percentages of tasks returning no data without generating alert noise.
Enjoy...
UPDATE 2022-08-09 - scroll down for updated, improved, re-written "v2" modules that provide more data.
PropertySource:
"NoData_Tasks_Discovery": v1.3: NPEMD9
DataSources:
"NoData_Tasks_By_Type": v1.3: N6PXZP
"NoData_Tasks_Overall": v1.3: 3A4LAJ
Substantial kudos goes to @Jake Cohen for enlightening me to the fact that the TlistTask import existed and these were therefore possible. Standing on the shoulders of giants, and all that.
NB. Immediately after a collector restart, the NoData counts and percentages will likely drop to zero, because while the collector will know the tasks it's going to run, none of them have failed since the restart because they haven't been attempted yet. Therefore, don't set delta alerts.
It might look a bit like this in a dashboard for total tasks per resource:
Or for a specific task type on a resource:

Yes, I have a lot of NaN on some of my resources, thanks to years of experimenting. I probably ought to tidy that up, and now I can see where I need to concentrate my efforts...