Forum Discussion

asikarwar's avatar
3 months ago
Solved

Process Monitoring

 Hi @Stuart Weenig Thank you for your awesome work!

I was able to use the Win_Process_Stats_Groovy.xml file for creating data source for Process.

https://github.com/sweenig/lm/tree/main/ProcessMonitoring

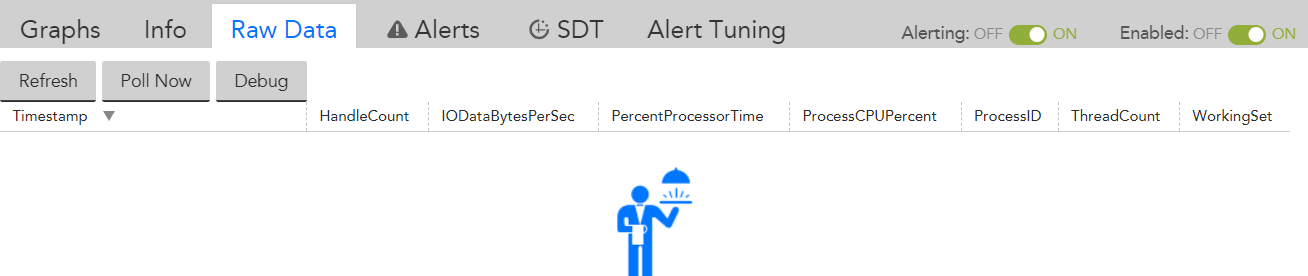
I am able to see data in Discovery and Collector but under Raw Data in Devices > Data source I do not see any data , when I poll I do see data, am I missing something.

My Applied To Wizard has the following query

I removed the Win_Process_Stats.excludeRegEx & Win_Process_Stats.includeRegEx  from “Applies To”

isWindows() && system.displayname == "server001" or system.displayname == "server001"

  • Standard troubleshooting: do you see the instances you expect? You have to make sure Active Discovery has completed successfully before you even work about data. You’re showing a raw data tab, which you’d only see after the instances were discovered, so i’m assuming you see your desired processes.

    What does poll now show? If poll now shows data, but there are no rows on the raw data tab, check to make sure your timeframe filter isn’t showing a time in the past before the instances existed. Select your timeframe and make sure it shows either last hour or default.

    If you still don’t see any rows in raw data, that’s a serious problem with LM. If LM is scheduling the task and it’s failing, you’d see rows with “no data” in each column. The fact that you’re not seeing any rows at all would be troubling and deserving of a support call.

10 Replies

  • You don’t need to modify the AppliesTo, at all. Just put the inclusion and exclusion properties only on the devices having the processes you want to monitor.

  • Standard troubleshooting: do you see the instances you expect? You have to make sure Active Discovery has completed successfully before you even work about data. You’re showing a raw data tab, which you’d only see after the instances were discovered, so i’m assuming you see your desired processes.

    What does poll now show? If poll now shows data, but there are no rows on the raw data tab, check to make sure your timeframe filter isn’t showing a time in the past before the instances existed. Select your timeframe and make sure it shows either last hour or default.

    If you still don’t see any rows in raw data, that’s a serious problem with LM. If LM is scheduling the task and it’s failing, you’d see rows with “no data” in each column. The fact that you’re not seeing any rows at all would be troubling and deserving of a support call.

  • Following 2 changes I made in the file

    1. Removed exclusion and inclusion as I wanted to only exclude Idle and _Total for all instances
    2. Its under ungrouped

    <appliesTo>isWindows() &#38;&#38; system.displayname == &#34;server001&#34; or system.displayname == &#34;server002&#34;</appliesTo>

    <group></group>

  • You don’t need to modify the AppliesTo, at all. Just put the inclusion and exclusion properties only on the devices having the processes you want to monitor.

    Yes I realized it after I posted 😀

  • Am I missing anything because I do no see data under Devices > Raw Data 

    As you can see its blank

  • Yeah, if you see data in poll now and you don’t have a weird timeframe applied, but never see any rows, that likely means the task isn’t getting scheduled by the platform onto the collector. If the task were scheduled and any sort of error occurred, you’d see rows. They’d have data if it worked and “no data” if the task failed.

    They’ll probably have you run a `!tlist h=<ip of target device>` to see the status of the task. you could include that output when you open the ticket to give them a headstart.

  • @Stuart Weenig you were right it was the time range, I am new to the UI 😅

    Thanks for all your help!

    One last thing how do I measure or see performance stats for Groovy Batch script Vs WMI Query call?

    As you mentioned in your report that Groovy WMI will help us reduce to one call per device to get all Processes, is there a way we can compare between the WMI Discovery method WMI Query call (Win32_PerfRawData_PerfProc_Process) & Groovy Batch script.

    Will not WMI Query call (Win32_PerfRawData_PerfProc_Process) also get all the processes in one go, isn’t that correct?

  • @Stuart Weenig you were right it was the time range, I am new to the UI 😅

    Can’t tell you how many times that’s tripped up experienced LMers.

  • Yes I did my basics 😀

    I am able to see data in Active Discovery.

    I am able to see data in Poll.

    Yes I think I may need to reach out to LM Support.

    Thanks @Stuart Weenig  you have been very helpful!