Forum Discussion

Sharath's avatar
Sharath
Icon for Neophyte rankNeophyte
5 months ago

Meraki Monitoring

Recently we have discovered Meraki devices by using Advanced Netscan. We are facing 2 issues
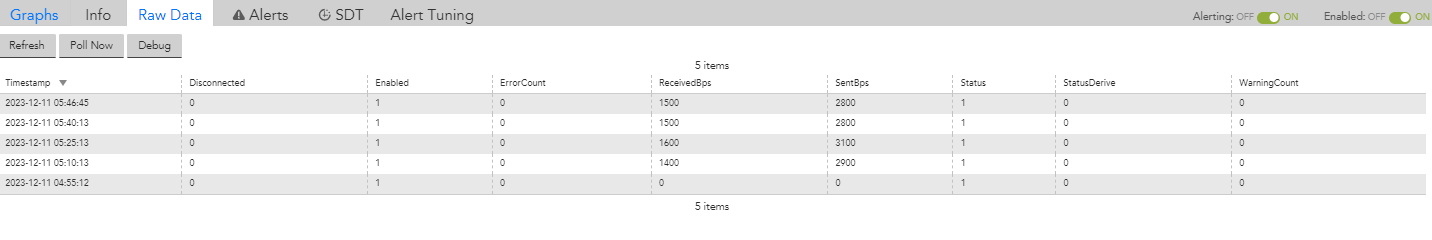
1) while monitoring the Access Point/Switch Performance & Port capacity. Under the Raw data Tab i am seeing No Data. 

Even i change the Threadpool under bactchscript timeout of 20 to 40 Sec. after doing this also i am not  seeing any data. I Tested the script from the data source level also checked but we are not seeing data.
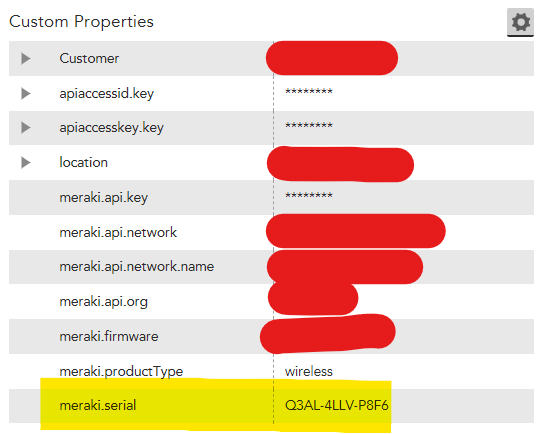
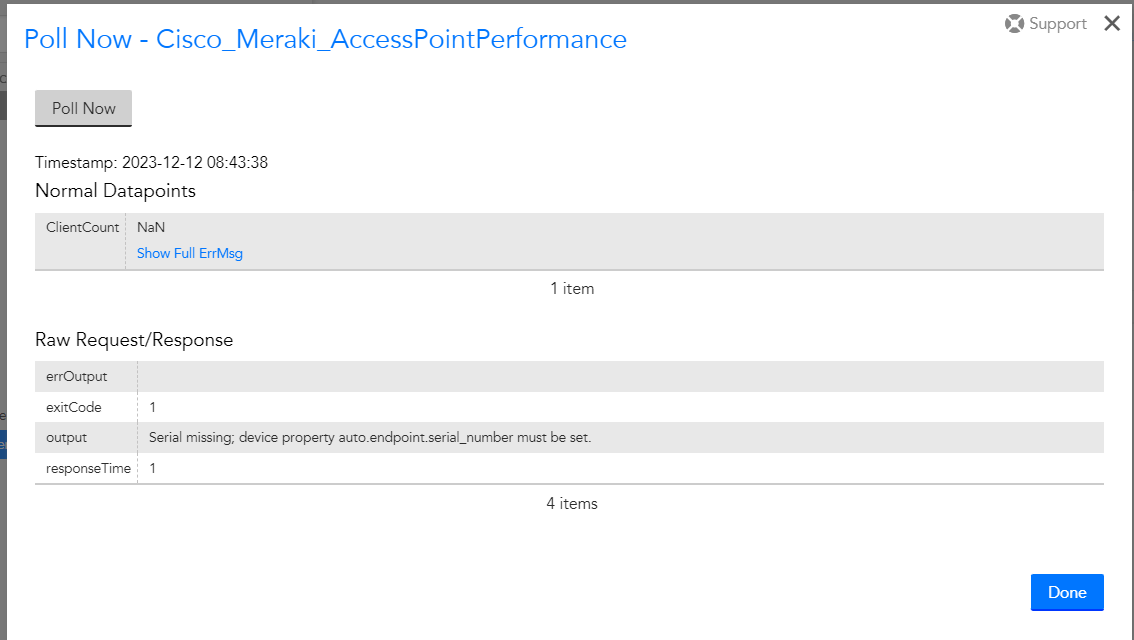
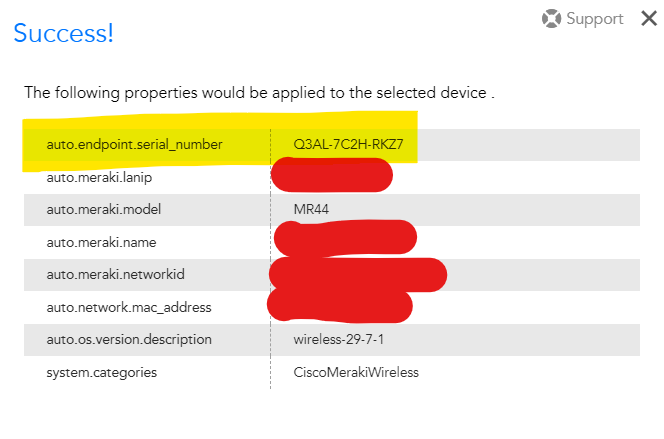
earlier it was showing Serial Number was missing, I am seeing the Serial Number under Custom Properties. We are not added manually. instead of seeing in Auto properties. It is showing under Custom Properties.

2) There is issue with Netscan where it is not adding devices to desired path, I mentioned the Desired Path under the Netscan Properties but still it is showing under the parent group. If i moved manually when i run the netscan again it will come under parent group.

Please guide me how to resolve this Issue ?

5 Replies

  • The custom properties that start with “meraki.*” were set by the Enhanced Script NetScan and the ones that start with “auto.*” were set by a PropertySource. PropertySources can only write to auto. properties and system.categories.

    If you are troubleshooting a problem with official modules, please engage product support so we can assist you and escalate we find a defect.

    Thanks.

  • 1. If you are not seeing the client count on any of the performance datasources, or if the Meraki Interfaces datasource is not applying to Access Points or Security Appliances, then meraki.snmp.* properties are not properly configured as specified here:

    https://www.logicmonitor.com/support/cisco-meraki-monitoring

    1. To create newly discovered Meraki devices in a specific resource group (or to have the NetScan create this resource group) use the “meraki.api.org.folder” credential property as described in the above support article.
  • Hi Patrick,

    I checked in the Meraki dashboard, SNMP is enabled, Only issue i am facing currently is unable to Monitor the Client Count under Switch/Access Point Performance. I am able to monitor Meraki Interfaces , Meraki API & Meraki health. I have attached the  snapshot of the properties being used currently under Netscan & also Meraki Interfaces data which is being Monitored.

  • Hey Patrick,

    Today we have tested for another customer. Even for this Customer i unable to monitor Access Point Health & Performance. When i test the script I am getting an error called “Serial missing; device property auto.endpoint.serial_number must be set.” . I am seeing the serial number under the Custom Properties i have not set it manually. I have attached the screenshot in my previous Conversations same Properties are used for this customer as well. I don’t know exactly why  it is coming under Custom properties not under Auto properties. Can you Please Guide me how to fix this Issue ?

  • When i test the Script Under “addCategory_Cisco_Meraki_Device” Property Source i am seeing the auto.endpoint.serial_number is getting, but when i see the info below the device this property is not showing.