Forum Discussion

Kerry_DeVilbiss's avatar
6 years ago

LogicMonitor Portal Metrics

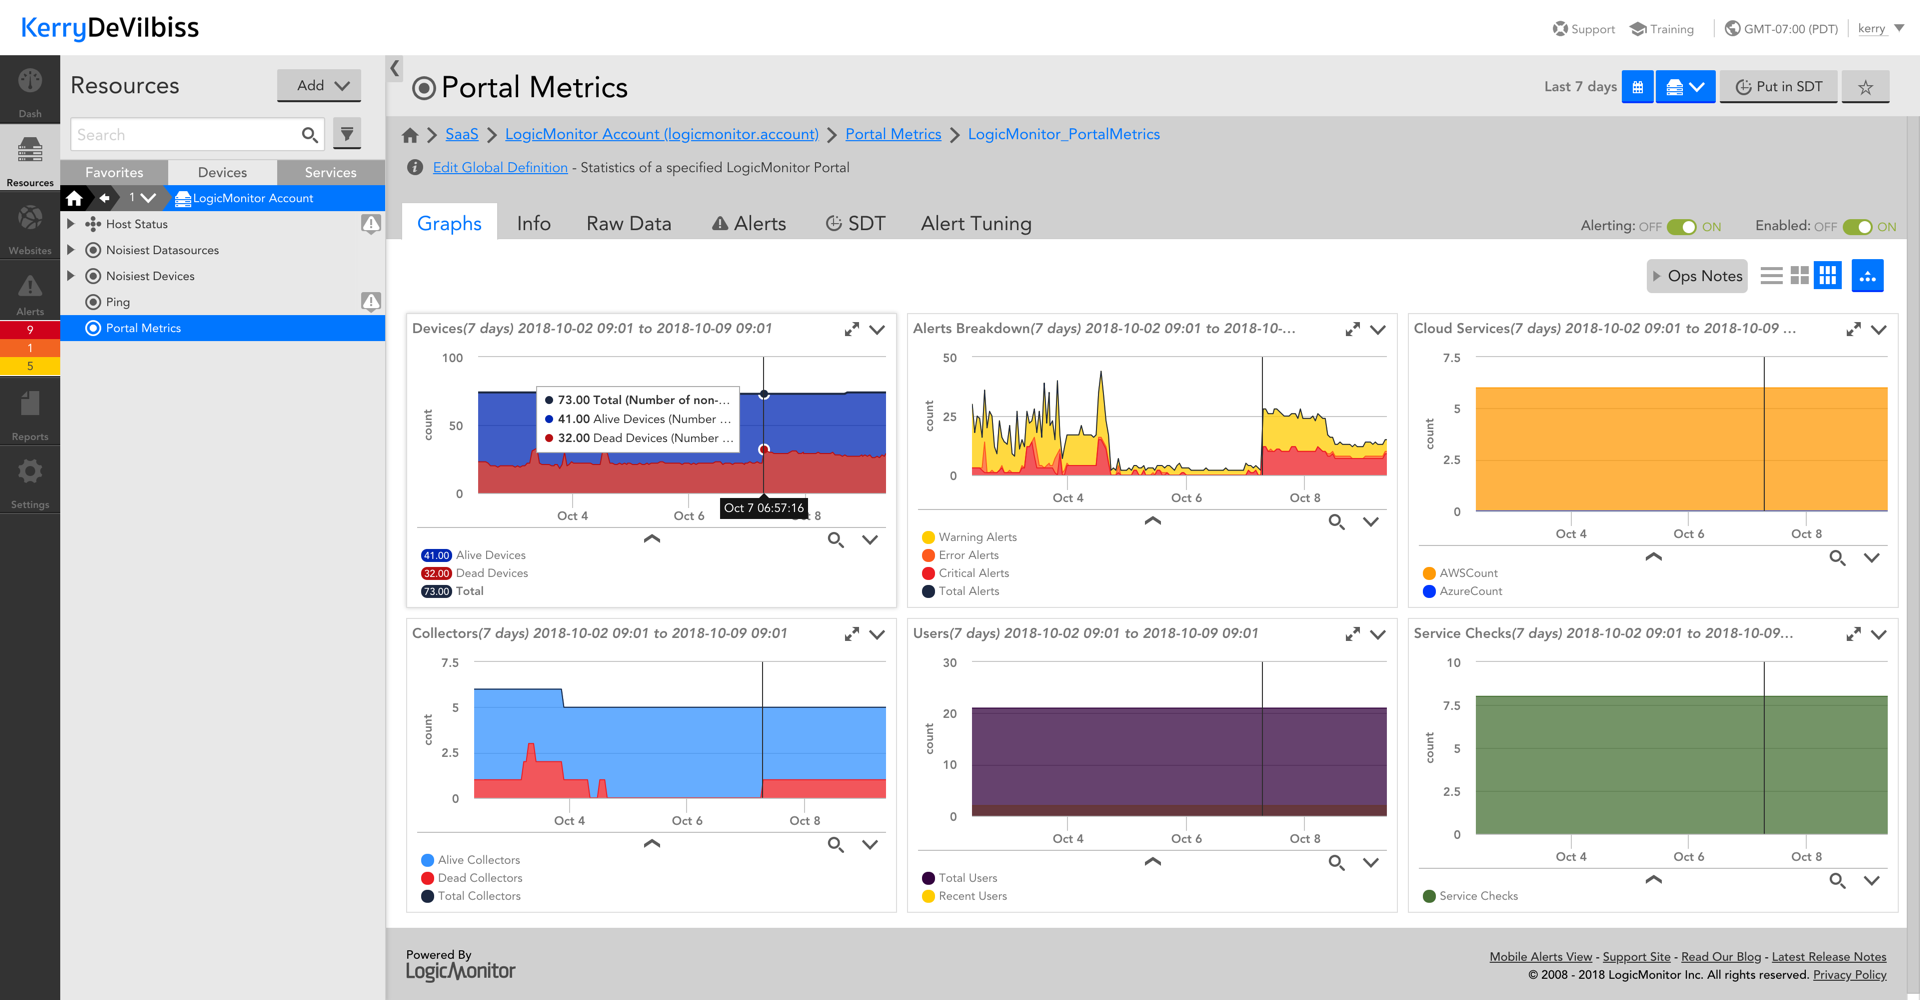
LogicMonitor Portal Metrics is a DataSource that queries the API of a specified LogicMonitor portal for overall statistics such as device, collector, and alert counts. It was originally written by fellow Sales Engineer @Jake Cohen, and updated by Monitoring Engineer @Julio Martinez (credit where credit is due!) It can be useful for tracking the activity within an account over time.

83f54752f45e6945af13ebe95297dbd6.png

The recommended/ required method for implementing the DataSource is as follows:

  1. Download the LogicMonitor Portal Metrics DataSource from the LogicMonitor Repository using locator code J7RGZY.
  2. Add a new device to your account in Expert Mode - use 'logicmonitor.account' in place of IP Address/ DNS and whatever you'd like for the Display Name (LogicMonitor Portal, for example.)
  3. - This device won't respond to standard DataSources, so you'll probably want to do some alert tuning once it's been added.
  4. Add properties to the device to allow the DataSource to authenticate. The required properties are:
  • lmaccount (LogicMonitor account name - without the logicmonitor.com at the end)
  • lmaccess.id (LogicMonitor API Key Access ID)
  • lmaccess.key (LogicMonitor API Key Access Key)
  1. Once those properties are in place, the DataSource should automatically apply to the new device.
  2. Download the LogicMonitor Portal Metrics dashboard from Github.
  3. Let us know what you think!

17 Replies

  • @Kerry DeVilbiss this is awesome. Question for y'all on this, the total alert count looks to be maxing at 800. I haven't done any troubleshooting yet to see if that's just what it's reporting, but curious if that's a limitation somewhere in the script.

  • Cool. We do a similar thing for alert volumes in each of our regions, the types of alerts (based on data points) and the alert acknowledgements by operator.

  • This datasource is exactly what we are looking for, but there is one problem.

    It isn't returning the proper counts for alerts.

    I tried adjusting the two variables

        int maxPages = 5
        int itemsPerPage = 800

    But the most I could get is 1000. Our current count is 9079 Warnings, 415 Errors and 284 Criticals, but everything gets moved to all equal 1000. Even when I adjust the two variables to a much higher rate.

  • I can't seem to edit my post.

    It appears the paging parameters aren't working, most likely the offset.

  • Thank you, Kerry, for making this available!

    I made a minor change to fix pulling of alert metrics, available at GJNN46.

    I also included an optional, commented-out variation of the function that processes alert metrics to account for SDT, resulting in numbers similar to those shown on the Alerts tab in LogicMonitor's sidebar. Using that would also make available a new metric - 'SDTedCount' - with the number of active alerts in SDT. (You'd need to add that metric as a datapoint if you try that alternate function.)

  • Release notes for .142 (I think) indicated that datasource LM_Device_Count had been deprecated and the replacement is Logicmonitor_Portal_Metrics.

    I don't recall how/if LM_Device_Count was related to this dashboard, but I upgraded Logicmonitor_Portal_Metrics anyway and all widgets (except the Resource Types Monitored pie chart) now display "Instance not found".   Here's the steps I took:

    • upgraded Logicmonitor_Portal_Metrics, deleted LM_Device_Count
    • installed propertysource addCategory_LogicmonitorPortal
    • added properties lmaccount, lmaccess.id, lmaccess.key to a collector
    • upgraded that collector to 29.104

    There's a piece of the puzzle I am missing here, probably pretty obvious, but I haven't been able to figure out what it is.  Anybody have any ideas?

    thx