Forum Discussion
Mike_Moniz Professor
5 years ago Professor
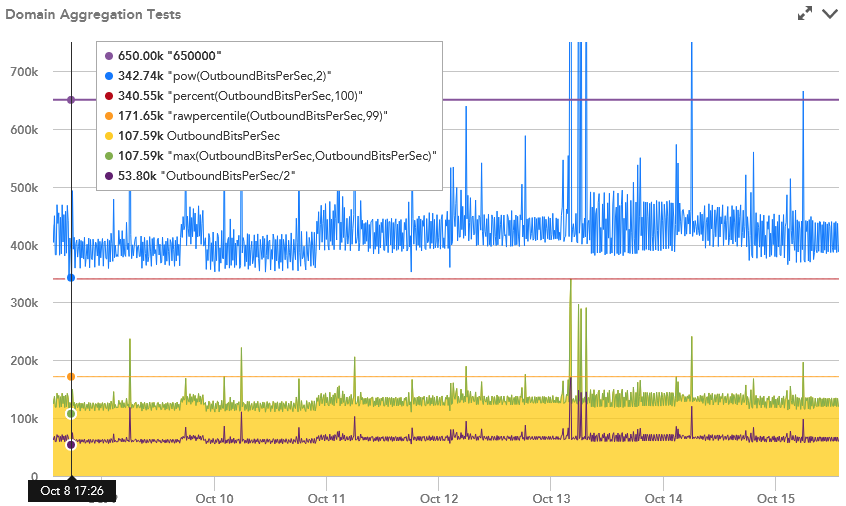
Thanks. I did some testing but the only functions that seem to work as domain aggregation, where you get a straight trend line, is percent and rawpercentile. The other functions seems to use the point-in-time value rather than all the data displayed, unless you do something that always outputs the same value regardless of the datapoint value, like just providing a static number. Cool that you can use something like percent(datapoint,100) and percent(datapoint,0) to get the max and min of the graph shown though!

Thanks!
