Forum Discussion

ldoodle's avatar
ldoodle
Icon for Advisor rankAdvisor
11 months ago

Filter widget based on datapoint values

Hi,

I suppose following on from my other message about combining CPU and memory in the same table widget, can these widgets be filtered - not dynamic/on demand but statically?

Take this example - can I have another table that only shows, for example, resources whose CPU OR Memory OR Uptime is beyond a certain threshold, e.g. ‘where CPU > X OR Memory > Y OR Uptime > Z’
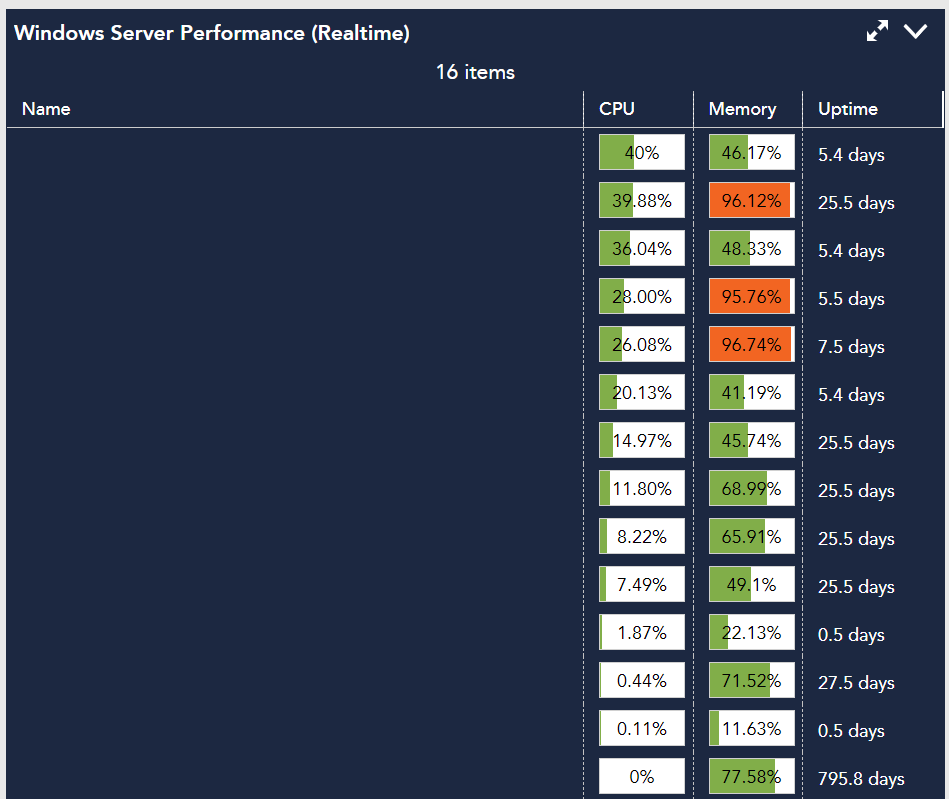
Then expanding on that, I’m aiming for a dedicated dashboard highlighting ‘at risk’ or ‘concerning’ resources, so ideally this filter could be done at the dashboard level (e.g. with a ‘filter’ token) resulting in widgets on that dashboard inheriting the filter.

Thanks

  • Anonymous's avatar
    Anonymous

    No, not by group. The portal stats has total alert counts. You could pretty easily build a datasource that hits the LM API to get the alert counts by group though. Your groups would be your instances and you’d call /device/groups/{groupID}/alerts to get the list of alerts that you can then count by severity.

  • No, not by group.

    By “group” here, I mean each customer’s ‘Summary’ dashboard would have this Big Number widget with the breakdown, or even distinct Big Number widgets for each severity. Or even a Pie widget.

    So the dashboard would have the ##defaultResourceGroup## token which would then inherit through to whichever widget I choose.

    That way, would I still need to call the API for a particular group’s alerts? Or could I just return them all and then the dashboard token does the filtering?

  • Anonymous's avatar
    Anonymous

    You’re getting ahead of yourself. You need to have the data before you can display it on the dashboard. So, you need a custom datasource where the instances of the datasources are the customer groups. The collection would collect the number of open, ack, sdt, etc. alerts per customer (i.e. per customer group). Once you have that, you’d put as many big number widgets or pie graphs as you want, filling in with the data from your datasource. You’d need to use an additional token that would match on the instance name, which would be the customer name.