Forum Discussion

James_Rolt's avatar
2 years ago

Dynamic Thresholds

Hi,

I am looking at setting up dynamic thresholds for the following datasource and datapoint:

Datasource - VMware_vCenter_VMPerformance

Datapoint - CpuUsagePercent

With the idea that if a VM in our VCenter enviroment goes above the normal level it would alert. I have currently setup an instance group and added the required instances into this (We dont want it on all VMs) but looking at the custom settings for some of the VMs the graph is above the 100% limit (example below)

2a7d46d8d057dec890dcc252d92069e0.png

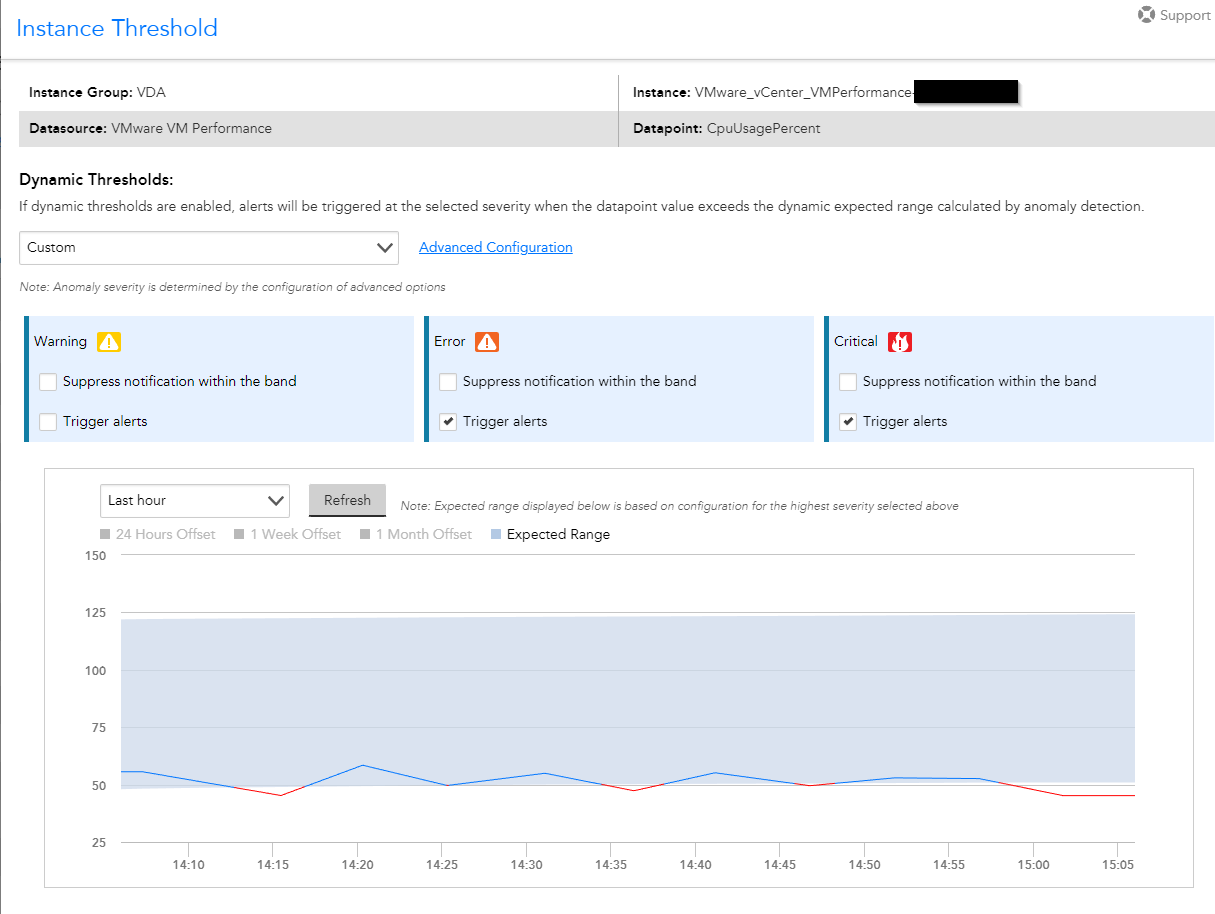
So how would this alert, as the metric would only go up to 100% CPU Usage at a max. 

Thank you,

James

3 Replies

  • The dynamic threshold visualization isn't smart enough to know that the metric can't/won't go above 100%. It's just calculating what the expected value might be based on historical norms. I'd lengthen the timeframe that you're looking at to get a better idea of what the algorithm thinks compared to actual values. You're right though, this particular CPU seems to run hot, so a dynamic threshold would consider 100% utilization "normal". Remember, dynamic thresholds don't tell you what's good vs. what's bad. They tell you what's "normal" vs. "abnormal". If this server normally fluctuates between 50% and 100% all the time, then a current value of 99.9% would be considered "normal" and wouldn't trigger an alert.

  • We use a mix. We use dynamic thresholds for Error level severity and static thresholds for Critical. That way, if the CPU ever gets too high, we get a critical.

  • 16 minutes ago, Stuart Weenig said:

    The dynamic threshold visualization isn't smart enough to know that the metric can't/won't go above 100%. It's just calculating what the expected value might be based on historical norms. I'd lengthen the timeframe that you're looking at to get a better idea of what the algorithm thinks compared to actual values. You're right though, this particular CPU seems to run hot, so a dynamic threshold would consider 100% utilization "normal". Remember, dynamic thresholds don't tell you what's good vs. what's bad. They tell you what's "normal" vs. "abnormal". If this server normally fluctuates between 50% and 100% all the time, then a current value of 99.9% would be considered "normal" and wouldn't trigger an alert.

    Ah ok, so in this case with CPU usage, it would be best to have it at a static threshold, that may need to be tuned per instance to a level to reduce noise

    Thanks