Forum Discussion

Vitor_Santos's avatar
5 years ago

Datasource to monitor Windows Services/Processes automatically?

Hello,

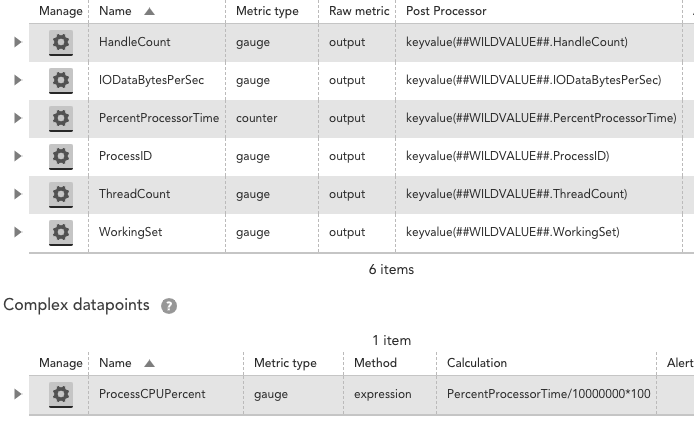
We recently cloned 2 Logic Monitor out of the box datasources (name -> WinService- & WinProcessStats-) in order to enable the 'Active Discovery' feature on those.
We did this because we've the need to discover services/processes automatically, since we don't have an 'exact list' of which services/processes we should monitor (due to the amount of clients [+100] & the different services/solutions across them)

After enabling this it works fine & does what we expect (discovers all the services/processes running in each box), we further added some filters in the active discovery for the services in order to exclude common 'noisy' services & grab only the ones set to automatically start with the system.
Our problem arrives when these 2 specific datasource start to impact the collector performance (due to the huge amount of wmi.queries), it starts to reflect on a huge consumption of CPU (putting that on almost 100% usage all the time) & that further leads to the decrease of the collector performance & data collection (resulting in request timeouts & full WMI queues).

We also thought on creating 2 datasources (services/processes) for each client (with filters to grab critical/wanted processes/services for the client in question) but that's a nightmare (specially when you've clients installing applications without any notice & expecting us to automatically grab & monitor those).

Example of 1 of our scenarios (1 of our clients):

- Collector is a Windows VM (VMWare) & has 8GB of RAM with 4 allocated virtual processors (host processor is a Intel Xeon E5-2698 v3 @ 2.30Ghz)
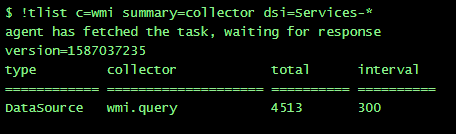
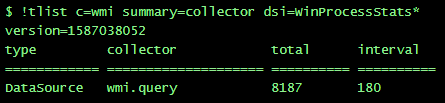
- Currently, it monitors 78 Windows servers (not including the collector) & those 2 datasource are creating 12 700 instances (4513 - services | 8187 - processes) - examples below

This results in approx. 15 requests per second

 This results in approx. 45 requests per second

According to the collector capacity document (ref. Medium Collector) we are below the limits (for WMI), however, those 2 datasource are contributing A LOT to make the queues full.
We're finding errors in a regular basis - example below


To sum this up, we were seeking for another 'way' of doing the same thing without consuming so much resources on the collector end (due to the amount of simultaneous WMI queries). Not sure if that's possible though.
Did anyone had this need in the past & was able to come up with a different solution (not so resource exhaustive)?

We're struggling here mainly because we come from a non-agent less solution (which didn't faced this problem due to the individual agent distributed load - per device).

Appreciate the help in advance!

Thanks,

  • Anonymous's avatar
    Anonymous

    It's funny, but my lab windows box is unlicensed, so i have about an hour to test stuff until it shuts off. Not a big deal to turn it back on, but it's making things slower. The first thing I did was convert PercentProcessorTime to a counter. That changed the values such that I'm now getting the delta between the current value and the previous poll's value divided by the time between them. So, theoretically, the resulting number should be pretty close, just needs to be adjusted to convert 100s of ns/s to unitless (%). Should mean just dividing the PercentProcessorTime (as a counter) by 107.  Got that in now and i'm going to let it bake to see if the results make sense.

  • 1 hour ago, Stuart Weenig said:

    It's funny, but my lab windows box is unlicensed, so i have about an hour to test stuff until it shuts off. Not a big deal to turn it back on, but it's making things slower. The first thing I did was convert PercentProcessorTime to a counter. That changed the values such that I'm now getting the delta between the current value and the previous poll's value divided by the time between them. So, theoretically, the resulting number should be pretty close, just needs to be adjusted to convert 100s of ns/s to unitless (%). Should mean just dividing the PercentProcessorTime (as a counter) by 107.  Got that in now and i'm going to let it bake to see if the results make sense.


    I've had problems attempting to do that in the past outside of LM but haven't really resolved it (kinda gave up at the time). I think you need to query the value twice over a set period and also take into account the number of logical cores in the system has. But even doing that I intermittently was getting weird results like 72025954.98% cpu. You'll see some various discussions on replicating task manager per-process cpu % via wmi on google.

    It would be great if there was a good solution to this though.

  • 12 minutes ago, Stuart Weenig said:

    So, this is what I ended up with (publishing to GitHub after a bit more data is gathered). Notice PercentProcessorTime is a counter and the formula on the complex dp.


    Thanks a lot for sharing!

    I've applied that to my datasource as well. 

    By checking the values against a process that's currently consuming 30-36% of the CPU, it's returning values like '143.5667' for that ProcessCPUPercent.
    I guess we need to divide that number by the number of CPU Cores for the server in question.

    In my case the box I'm testing that has 4 CPU Cores, which results in a value of 35.89%.
    It seems to reflect the actual usage of the process (shown in Task Manager) ?

  • Another suggestion for the services check, although this does deviate from the existing WinServices- check is instead of doing 0=Not OK and 1=OK, is to set 0=OK and 1=Not OK. Several other LM Datasources generally work this way in that the larger the number the more urgent the problem so you can do thresholds like > 0 1 2. In this case it that doesn't matter since it's binary option, but it also helps with widgets like table color bars where < does not work very well or gauge widgets and others that also seem to assume this.

  • 1 minute ago, Stuart Weenig said:

    Yes, that needs to happen. Otherwise, this metric is very much like CPULoad in Linux boxes, where 100% = one fully loaded core. The thing is that you can't just divide by the number of cores, because you don't know for sure that the threads are split evenly across cores.  


    Oh I see.
    Well, I guess despite that, diving by the number of cores will reflect the process usage on the whole CPU anyways, right?
    Even if it's not split evenly, that calculation will reflect the actual process use over the CPU (in a whole). Maybe I'm confusing.
     

  • Please ignore my above post ... dont know what i was thinking.?