Forum Discussion

Adam's avatar
4 years ago

95th Percentile Datasource

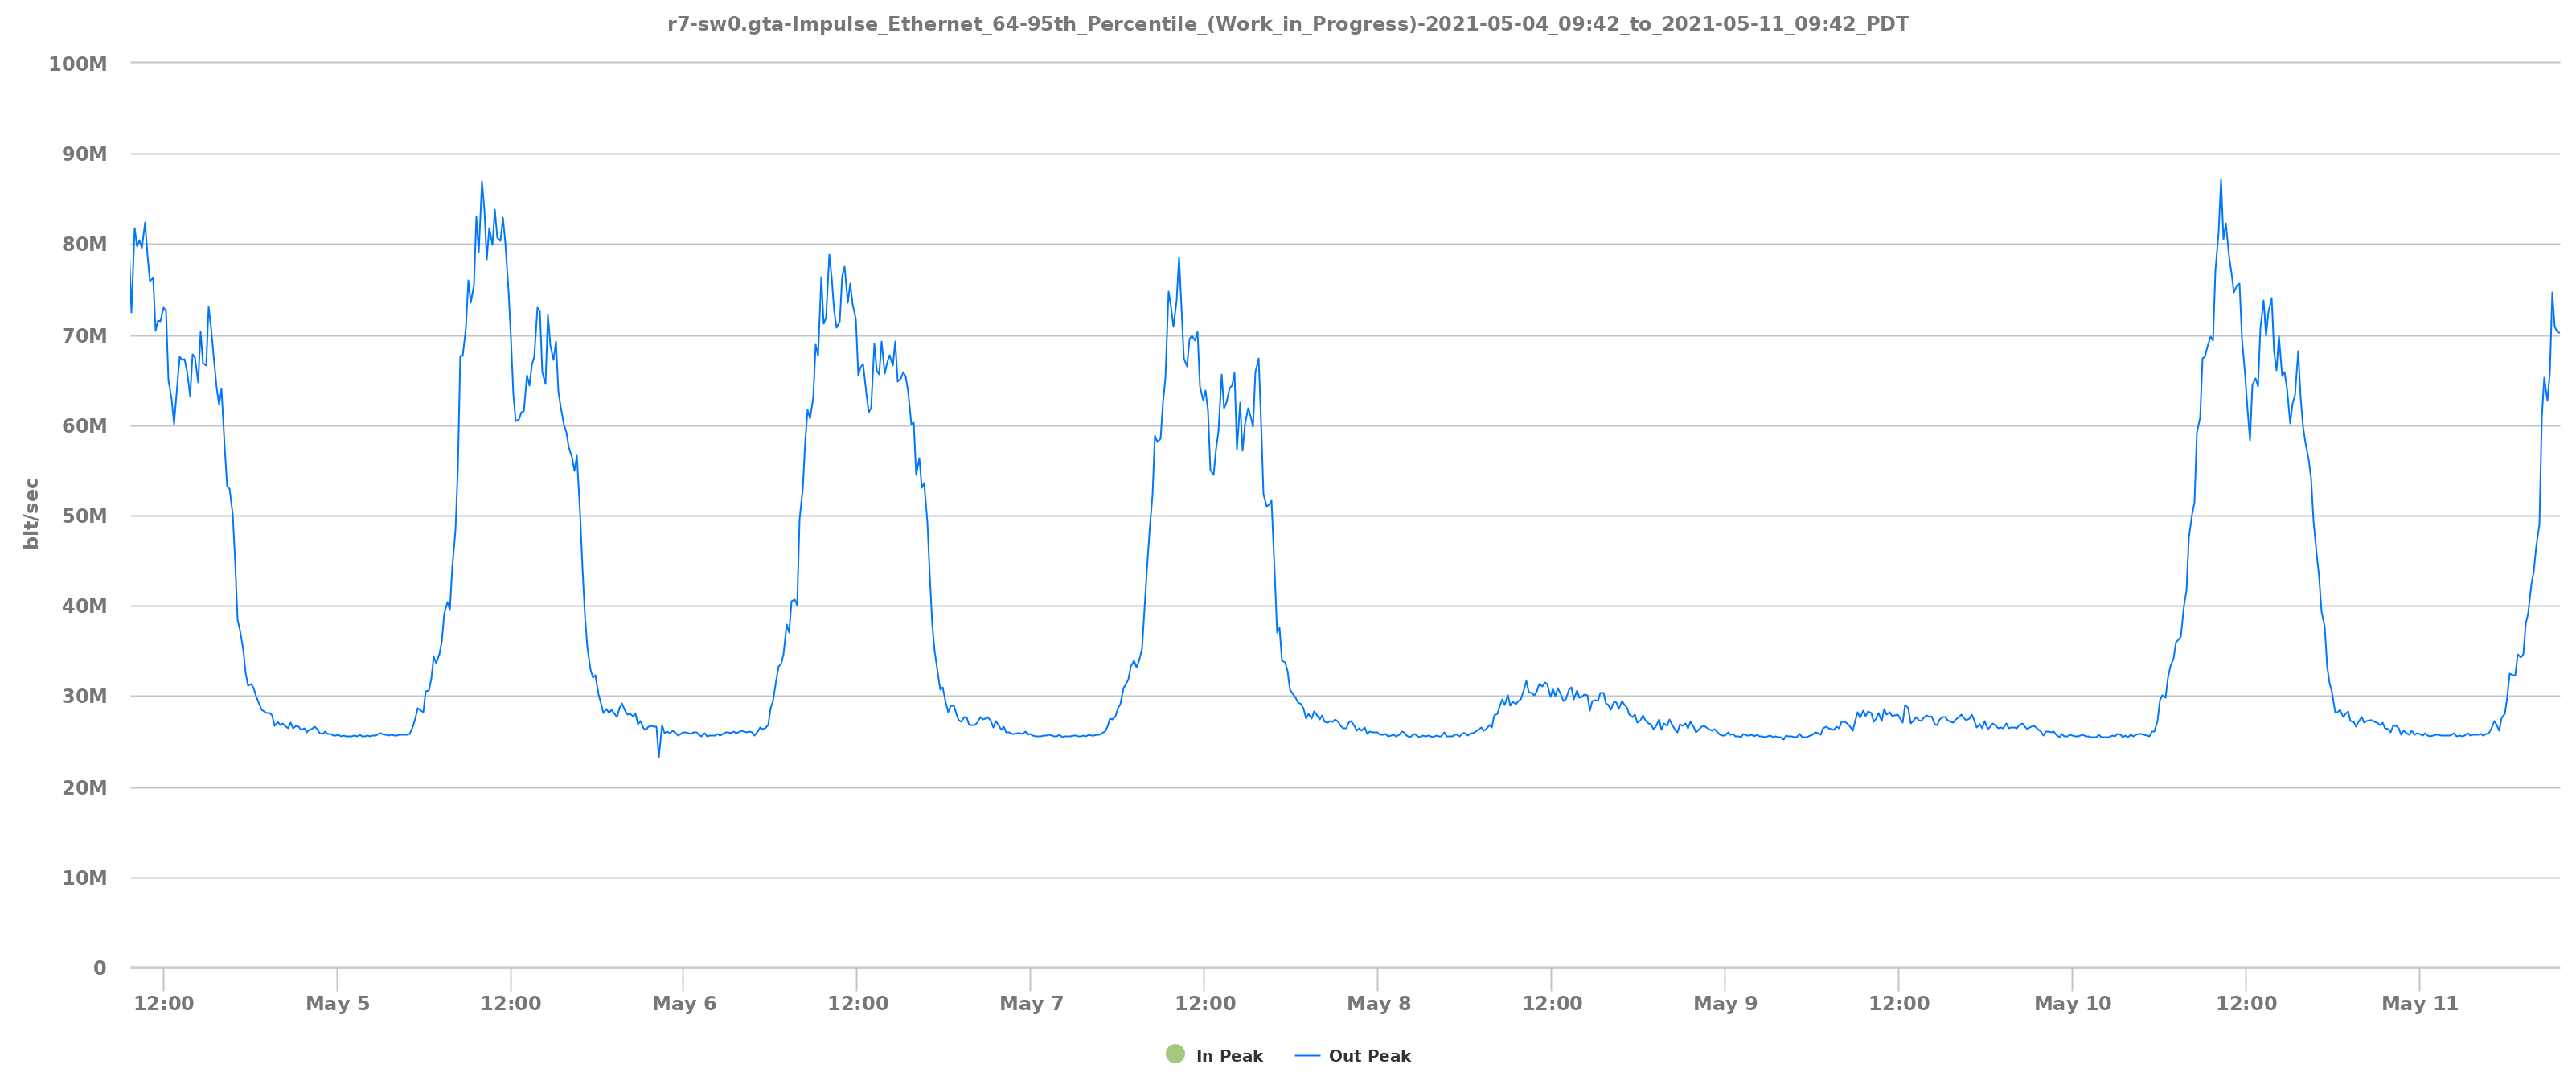
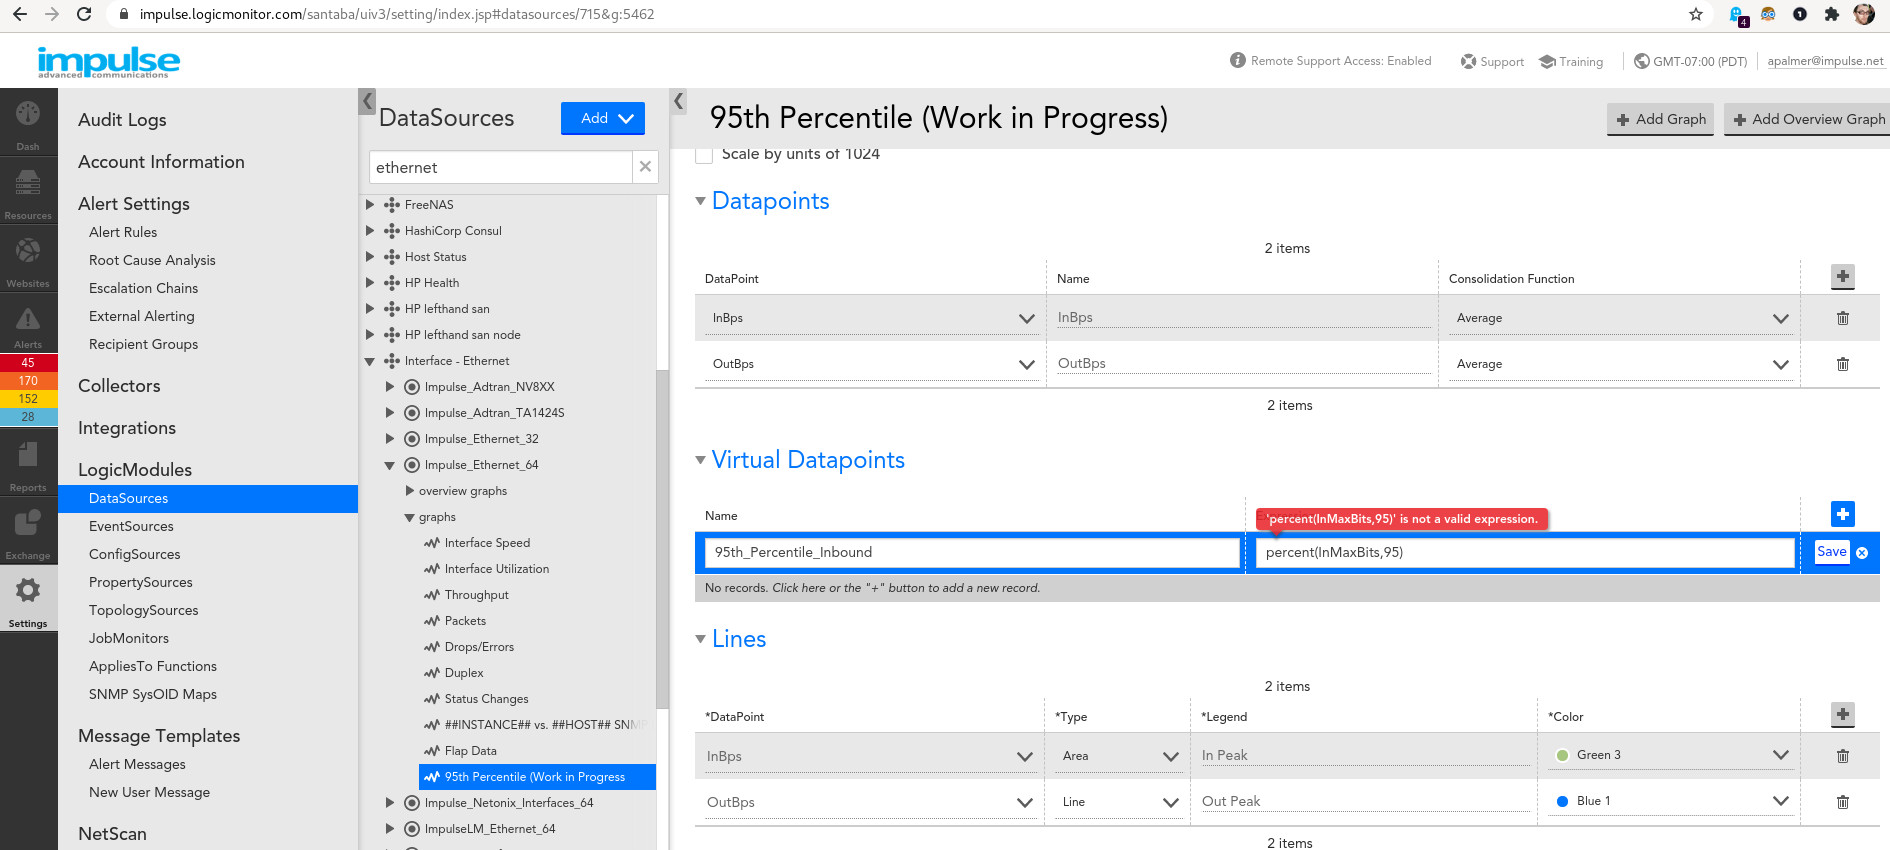
I've been asked to re-implement some monitoring that we used to aggregate from MRTG data, and I'm immediately baffled because it looks like there's a built-in datasource to do what we need (at least it's named like it would do so) but I can't for the life of me figure out what it's actually doing.  The 95th Percentile threshold over the course of a 30-day rolling period should move up and down much more slowly than these graphs do.  Is the time period absurdly short by default, or are there multiple entirely different things called "95th percentile"?

If the default behavior of this probe is either documented or exposed anywhere, that'd be helpful.  If anyone can offer any color on why this behaves the way it does, that'd be positively stellar.

8 Replies

  • Anonymous's avatar
    Anonymous

    If you're looking at the SNMP_Network_Interfaces datasource, the 95th percentile datapoints in there are mistakes. They do not do what the developer thought. Those infix functions can only be used in virtual datapoints in graphs, not in a complex datapoint in a DataSource. The developers are aware of this and we should be getting a fixed version pushed out soon. 

    In the meantime, all you need to do is create a virtual datapoint on the custom graph and specify your percentile parameters there.

    The thing to think about is that 95th percentile requires a sample of data. In the DataSource, there's only one piece of data: the current poll's result. So the 95th percentile of one datapoint is the datapoint itself. There appears to also be some funny math there as well since it seems to calculate 95% instead of the 95th percentile of that single datapoint. When you do it as a virtual graph, the graph's total included duration dictates what data can be included in the percentile calculation and you'll get a much more expected number.

  • 8 minutes ago, Stuart Weenig said:

    If you're looking at the SNMP_Network_Interfaces datasource...

    Actually the more I acquaint myself with this, the more it looks like I'm actually looking at a custom datasource entitled "Impulse_Ethernet_64".  Where I'm stuck is that I can't locate a datapoint named *95* as part of that datasource, so I'm entirely confused as to how we could be graphing a datapoint that doesn't seem to exist.

    As an aside, LM Support chat just sits and spins in Chrome, and throws a "high volume, do you want to make a ticket?" dialog in Firefox.

    When I make a ticket, I get an email with a support.logicmonitor.com link, but attempting to either Sign Up or Reset password throws a "logicmonitor.zendesk.com refused to connect" error so I'm just having an absolute party over here trying to get help figuring this out.

    To the extent that it matters, that Ticket number is apparently 244730.

  • Anonymous's avatar
    Anonymous

    Hm, i'll check to see if anything is going on with support that's affecting more than you.

    It's very possible to graph a datapoint that isn't defined in the DataSource. This is exactly what I was referring to when I said:

    1 hour ago, Stuart Weenig said:

    In the meantime, all you need to do is create a virtual datapoint on the custom graph and specify your percentile parameters there.

    Within a graph definition, you can create a "virtual datapoint" that gets calculated at runtime. You would need to look in the definition of that graph to know which "real" datapoint you're calculating the 95th percentile. Since i cheated by taking a peek, that graph is pretty messed up. The title is misleading and it isn't configured to do any percentile calculation at all. It just plots inBps and outBps. If you look at the legend, it looks like it was labeled "peak", which is also misleading since it does nothing to actually calculate anything close to a "peak" value.

    Taking a step back: what do you want to accomplish here? Do you want 95th percentile? If so, i'd say modify this graph so that it uses a virtual datapoint to calculate that percentile value.

  • 4 minutes ago, Stuart Weenig said:

    Taking a step back: what do you want to accomplish here? Do you want 95th percentile? If so, i'd say modify this graph so that it uses a virtual datapoint to calculate that percentile value.

    You're correctly interpreting the objective.

    Where I'm stuck is that I can't connect that graph back to the datapoint being graphed.  I think once I locate the "under the hood" mechanics generating the graph, I have a decent idea of what I need to replace them with.  Problem is I'm not as good at Applies To logic, which seems to be set correctly here.  So I'm hoping to find and edit the existing datapoint, keeping the Applies To logic we currently have.

    Apparently I was wrong in my initial assumption that any datapoint being graphed at a spot in the directory tree must appear on the list of datapoints under Alert Tuning or on the list of Datapoints under LogicModules > DataSources > The DataSource In Question as this one appears in neither place... so where do I look and/or how do I search?

    As for the Support portal problems, they're apparently specific to my Chrome ( Version 90.0.4430.212 (Official Build) (64-bit) ).  Firefox seems to work fine, so fair enough.

  • Anonymous's avatar
    Anonymous

    Likely, neither the datapoint, nor the AppliesTo need to be modified. Instead, you need to edit the graph. You're looking in the DataSource and that's the wrong "hood" to open up. 

    If i'm guessing right, you are on the Settings page, under LogicModules >> DataSources and you have the Impulse_Ethernet_64 Datasource highlighted in the middle pane (middle pane of three) and you see the DataSource settings on the right pane.

    If that's the case, all you need to do is click the triangle next to the DataSource in the middle pane. This will open up two sub-options: "overview graphs" and "graphs". Overview graphs contains the definitions of graphs that appear when you select the DataSource when looking at the device. Graphs contains the graphs that display when you select an individual interface in the resource tree.

    Your screenshot shows a graph, not an overview graph. So, if you expand "graphs" by clicking the triangle, you'll see the graph definitions there. Select the 95th percentile (last one in the list, they are sorted by display priority, which you can set). From there you'll see that it pulls in the InBps and OutBps datapoints from the DataSource. You'll want to add a new Virtual Datapoint that calculates the percentile. You'll then want to replace the lines that are currently graphed with your new virtual datapoint.

  • Of course the problem was as simple as not noticing that the tree expanded further...  Now I feel silly.  Thanks for all your help.

    That silly feeling isn't at all ameliorated by this error message.  Can you tell I've been hitting my head against this for a while?  It's starting to get soft.  What obvious thing am I missing now?

  • Anonymous's avatar
    Anonymous

    Because "inMaxBits" isn't a datapoint that's available to the graph. The only ones that are available to that graph are the ones you pulled in up above: InBps and OutBps. Btw, the name used in the expression is in the "Name" column. That doesn't often differ from the "DataPoint" column, but it can.

  • Bah.  Now that I've figured out I need to use Firefox to get the Support Portal working, I'm going to stop mucking up the forums with my silly mistakes.  I'll circle back with a working config once I get there, for anyone passing through later who read through this far.