9 years ago
SDT Report
I want to have a report that will give me all devices that are currently under an SDT, that will show the device name, SDT Start Date, SDT End Date, and the comments of the SDT>
I want to have a report that will give me all devices that are currently under an SDT, that will show the device name, SDT Start Date, SDT End Date, and the comments of the SDT>
 Advisor
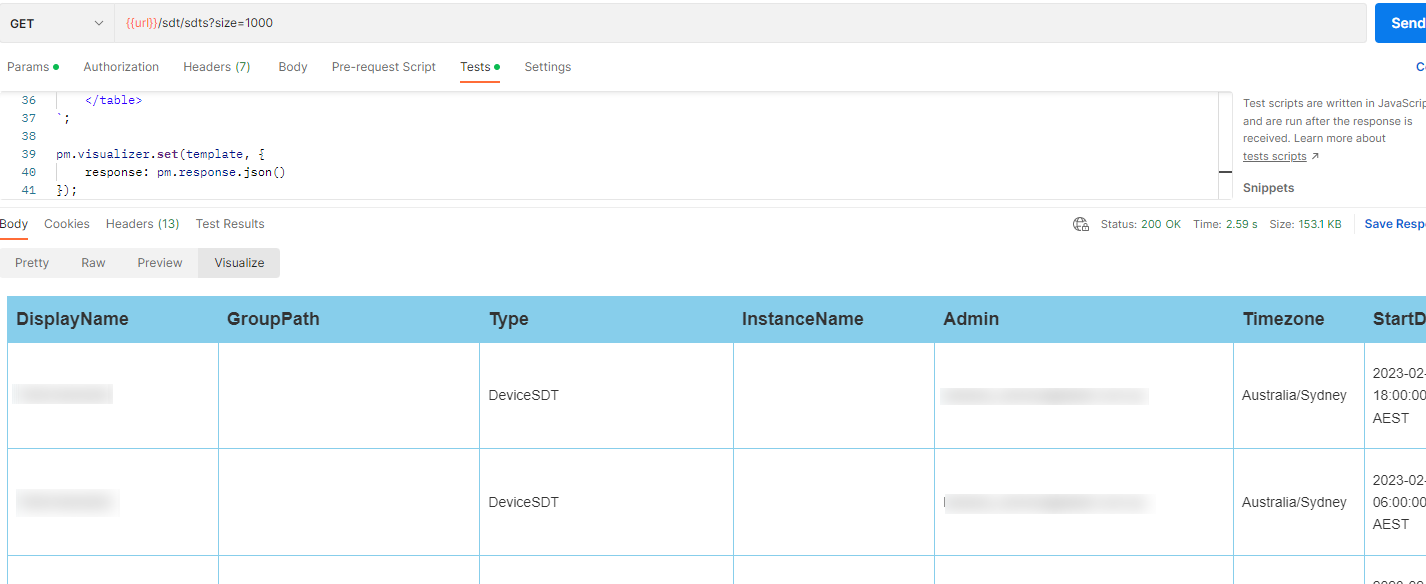
As a followup on this thread. The script was nearly perfect except i wasnt able to get the instance sdt quiet right. In the end i use postman visualize. You end up with a nice table.
this is the script in tests
var template = `
<style type="text/css">
.tftable {font-size:14px;color:#333333;width:100%;border-width: 1px;border-color: #87ceeb;border-collapse: collapse;}
.tftable th {font-size:18px;background-color:#87ceeb;border-width: 1px;padding: 8px;border-style: solid;border-color: #87ceeb;text-align:left;}
.tftable tr {background-color:#ffffff;}
.tftable td {font-size:14px;border-width: 1px;padding: 8px;border-style: solid;border-color: #87ceeb;}
.tftable tr:hover {background-color:#e0ffff;}
</style>
<table class="tftable" border="1">
<tr>
<th>DisplayName</th>
<th>GroupPath</th>
<th>Type</th>
<th>InstanceName</th>
<th>Admin</th>
<th>Timezone</th>
<th>StartDate</th>
<th>EndDate</th>
<th>Comment</th>
</tr>
{{#each response.data.items}}
<tr id=row_{{@key}} onClick="handleClick(this.id)">
<td id={{@key}}>{{deviceDisplayName}}</td>
<td>{{deviceGroupFullPath}}</td>
<td>{{type}}</td>
<td>{{dataSourceInstanceName}}</td>
<td>{{admin}}</td>
<td>{{timezone}}</td>
<td>{{startDateTimeOnLocal}}</td>
<td>{{endDateTimeOnLocal}}</td>
<td>{{comment}}</td>
</tr>
{{/each}}
</table>
`;
pm.visualizer.set(template, {
response: pm.response.json()
});
This is what the table looks like

You can use the LM API to modify a text widget on a dashboard to display the output of the above script.
 Professor
I'd like to be able to have something like a NOC widget on a dashboard that shows devices in SDT... not just for a specific DataSource, but at the device level and down. NOC widget currently requires me to select the DS to match against. Reports aren't as dynamic as we're looking for. Use case is support seems a machine out of load balancing, needs to check quickly to see if it's supposed to be out of load balancing. SDT workflow is part of our procedure and would allow the service desk to quickly determine whether or not they need to perform an action that can potentially break a client environment.
 Advisor
Confirmed this is almost there and is formatted much nicer to work with.
Thank you so much.
 Advisor
On 5/3/2022 at 2:26 AM, Guest Stuart Weenig said:
Thank you very much, i will give this a try as soon as i can :)/emoticons/smile@2x.png 2x" title=":)" width="20" />
This script gets pretty close, I think:
from lm import lm

devices = lm.get_device_list(size=1000).items
sdts = lm.get_sdt_list(size=1000).items

r = {}

for device in devices:
    r[device.id] = {"display_name": device.display_name, "name": device.name}
    r[device.id]["device_sdt"] = [s.to_dict() for s in [sdt for sdt in sdts if sdt.type=="DeviceSDT"] if device.id == s.device_id]
    r[device.id]["group_sdt"] = [s.to_dict() for s in [sdt for sdt in sdts if sdt.type=="DeviceGroupSDT"] if s.device_group_id in [int(i) for i in device.host_group_ids.split(',')]]

print("device_id,display_name,name,sdt_type,sdt_start_time,sdt_end_time,sdt_timezone")
for k,v in r.items():
    for ds in v['device_sdt'] + v['group_sdt']:
        print(f"{k},{v['display_name']},{v['name']},{ds['type']},{ds['start_date_time_on_local']},{ds['end_date_time_on_local']},{ds['timezone']}")
Uses my own personal library to build the Python SDK object called lm. Doesn't do pagination on the device, list, but that wouldn't be too hard to build. This also may output multiple lines for a single device, if multiple SDTs apply to the same device. Wouldn't be too complicated to flatten the list.
This is what the output looks like on mine:
device_id,display_name,name,sdt_type,sdt_start_time,sdt_end_time,sdt_timezone
58,LogicMonitor,lmstuartweenig.logicmonitor.com,DeviceGroupSDT,2022-05-02 10:25:00 CDT,2022-05-02 11:25:00 CDT,America/Chicago
62,Zoom,logicmonitor.zoom.us,DeviceGroupSDT,2022-05-02 10:25:00 CDT,2022-05-02 11:25:00 CDT,America/Chicago
78,Skilljar,status.skilljar.com,DeviceGroupSDT,2022-05-02 10:25:00 CDT,2022-05-02 11:25:00 CDT,America/Chicago
103,ConnectWise,staging.connectwisedev.com,DeviceSDT,2022-04-12 12:57:00 CDT,3022-04-12 14:57:00 CDT,America/Chicago
140,api.exchangeratesapi.io,api.exchangeratesapi.io,DeviceSDT,2022-05-06 20:00:00 CDT,2022-05-07 19:45:00 CDT,America/Chicago
140,api.exchangeratesapi.io,api.exchangeratesapi.io,DeviceSDT,2022-05-07 19:45:00 CDT,2022-05-08 19:30:00 CDT,America/Chicago
197,buttonmusic.local,buttonmusic.local,DeviceSDT,2022-03-23 10:23:00 CDT,3022-03-23 12:23:00 CDT,America/Chicago
239,boxxy.local,boxxy.local,DeviceSDT,2022-04-04 14:47:00 CDT,3022-04-04 16:47:00 CDT,America/Chicago
Hopefully I'll have some time today to repost my lmwrapper module (i had to pull it off github).
 Advisor
On 4/14/2022 at 3:43 PM, Barb said:We would also like this feature request
that will show the device name, SDT Start Date, SDT End Date, and the comments of the SDT also the customer. A report that can be shown to customers. The one that comes from the api is not easily manipulated into excel from STD Output. Any suggestions on how to make this report easier to read.
 Advisor
We would also like this feature request
On 4/20/2017 at 1:58 PM, pmeyer said:I want to have a report that will give me all devices that are currently under an SDT, that will show the device name, SDT Start Date, SDT End Date, and the comments of the SDT>
Do you mean within the web GUI? This functionality exists in the API: https://www.logicmonitor.com/support/rest-api-developers-guide/v1/sdts/get-sdts/