Forum Discussion

daniel_Briseno's avatar
5 years ago

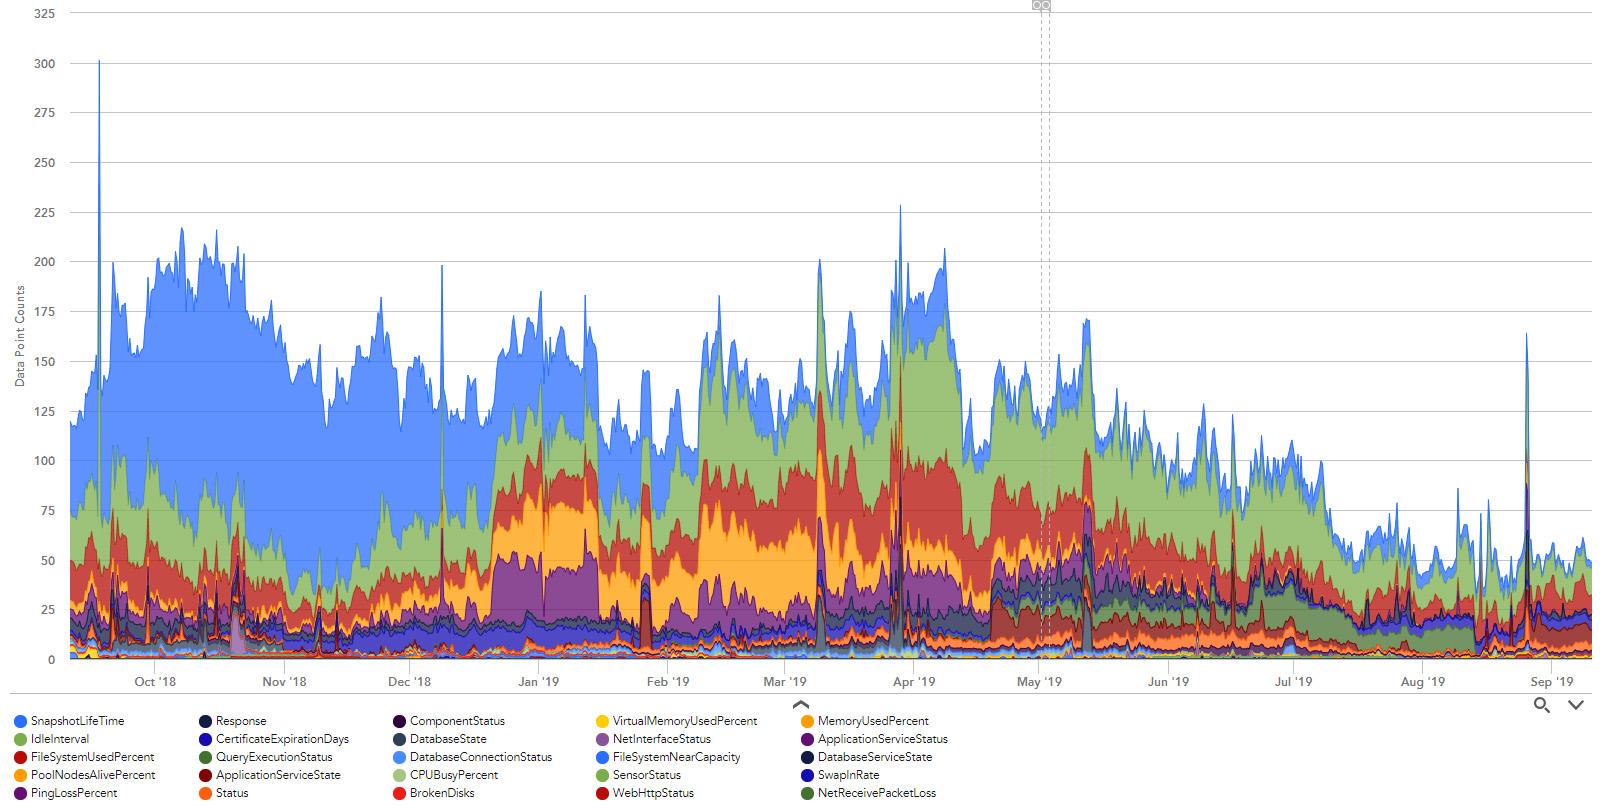
Line graph of alerts

I'd like a line graph to show alerts over time. In order of priority I would want to easily see specified groups of devices, then by device, and then by instance. This would greatly assist in identifying trends.

This post hints at a cumbersome workaround, but the ability to see number of alerts over time is a basic necessity and should be easy to accomplish. https://communities.logicmonitor.com/topic/732-number-of-alerts-on-dashboard/

Ideally this would just be an eventsource or a datasource which could be easily applied to any group whether it be website, resource or device.

4 Replies

Replies have been turned off for this discussion
  • Sarah_Terry's avatar
    Sarah_Terry
    Icon for Product Manager rankProduct Manager

    @daniel Briseno this is possible today with the API & a DataSource, but I do understand the desire to have this out of the box. Can you expand on the end goal here? It sounds like you want to identify the most noisy groups, devices & instances - will you then tune alert thresholds? Our roadmap includes several initiatives geared towards reducing noise & making alerts + thresholds more automated/intelligent, so I'd like to ensure that the root issue is addressed with these roadmap initiatives as well.

  • Hi Sarah, thanks for the follow up. I could see this being useful in a number of ways. Ultimately I'd like this to be part of our health assessment dashboards for our production applications. To be able to see the number of warnings, errors, and criticals occur in an entire environment month over month would be hugely helpful in us assessing the overall environmental health, as well as giving insights into what the people cost of suffering environments. We log warning and errors as JIRA tickets, so these graphs would make it easy to see which products are having issues over time, which teams are working round the clock for potentially related issues (or just busy work), and help us better focus our efforts on alert tuning and cleanup. Tuning and alerting is not really the goal but a nice by product. I'd like to see what LM sees as a function of time. This could also help me drive decisions around staffing, complexity of an environment, technical debt, profitability of a product,  commonalities in hosting platforms, i.e. colo vs public clouds, and likely additional topics just based on knowing how many alerts occur in any given subset of devices AND website checks.

  •  

    Hi @daniel Briseno

    I use a graph of datapoints (see attached). It's system wide view, but just wondering is this what you have in mind but rather by Resource Group or Resource object?

  • Mosh, Thanks for the reply- not sure this is what I am looking for, as your example looks to show number of particular datapoints. I am looking for the number of alerts historically for any group, device, datapoint. I.e.  it would show the active alerts at each point in time for the resources/websites in a group.