9 years ago
Custom Graph - customisable X axis
Hi,
The custom graph could do with being a bit more customisable. Presently the X-axis is alway time. This is often useful but not always.
It would be great to be able to define what's on the X-axis either just in terms of values or from datapoints.
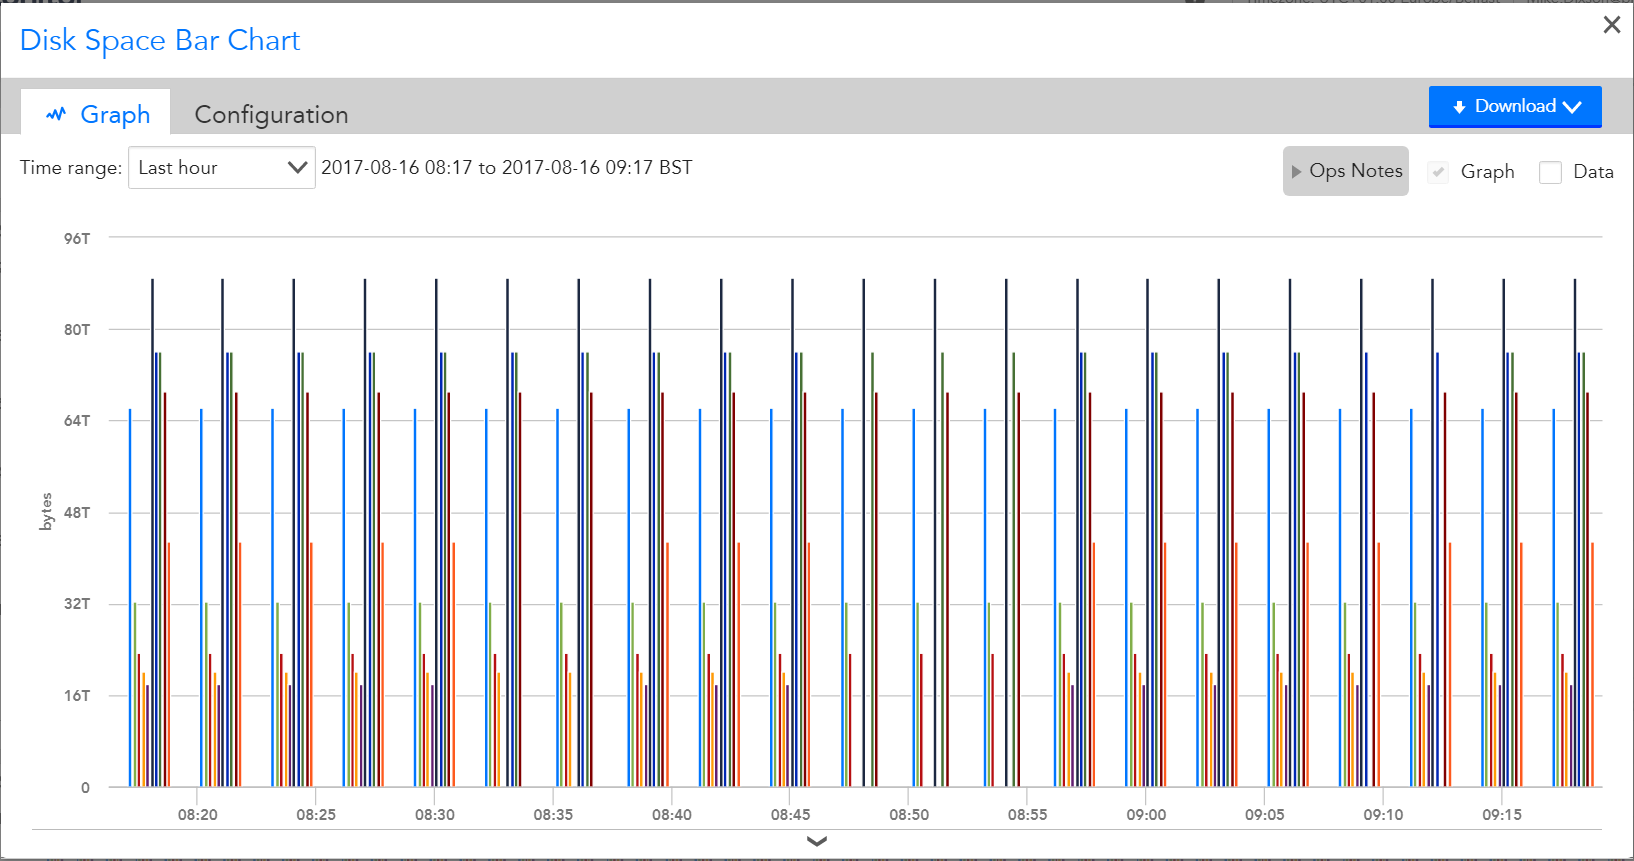
This was found whilst trying to create a dashboard to show disk space usage in a visually meaningful way.
Thanks
Mike