Alert Troubleshooting 101
One of the most common support cases we face every day is 'why am I receiving this alert', this article would explain to you the steps on how to determine why are you receiving the alerts.
1) Understand the alert received
2)Checking on validity via raw data and threshold
3)Checking on delivery
1) Understanding the alert received
The first step when you receive an alert either via email, text or via any ticketing system is to understand the alert. Understand an alert is to look at which device is the alert for, which datapoint and value of the alert.
For example in an email alert message, it would appear as per below.
LogicMonitor Alert:
Host: ##HOST##
Host Group: ##GROUP##
Datasource: ##DATASOURCE##
Datapoint: ##DATAPOINT##
Description: ##DSIDESCRIPTION##
Value: ##VALUE##
Level: ##LEVEL##
Start: ##START##
Duration: ##DURATION##
Reason: ##DATAPOINT## ##THRESHOLD##
##ALERTID##
2) Checking on validity via raw data and threshold
Next, once you determined the alert source, you need to understand why this alert is triggered. This can be done by first looking at the threshold that is set for that particular datapoint. After checking the threshold you can go to the raw data tab of the datapoint to check if it meets the threshold being sent.
For example
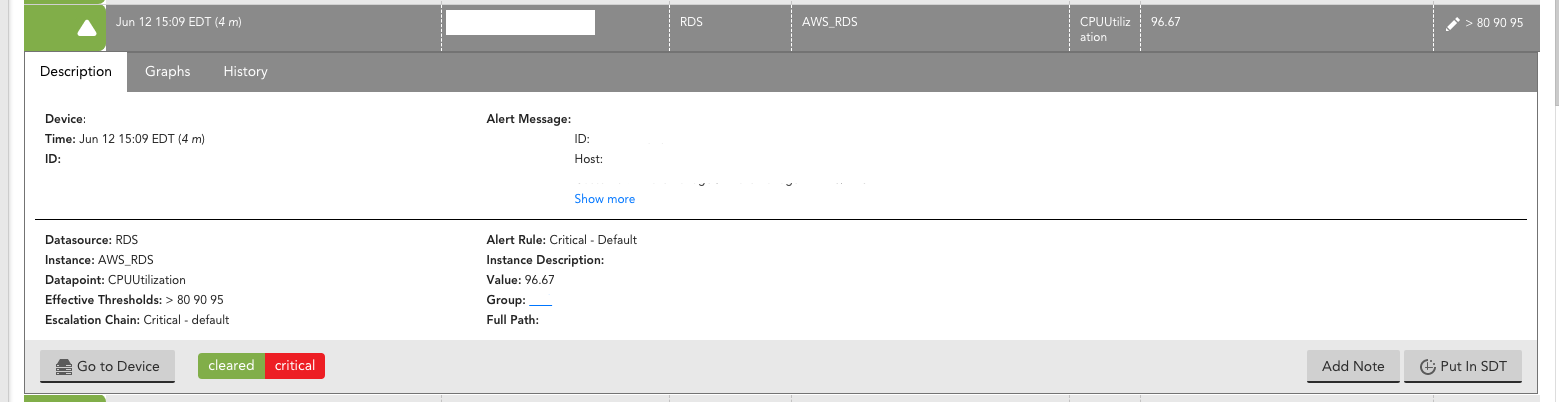
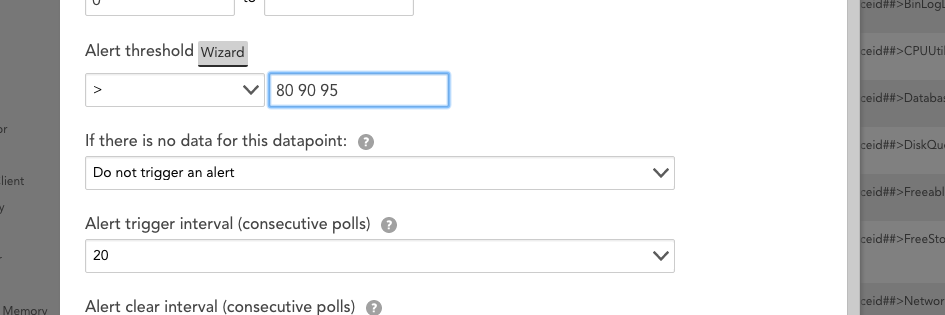
In this case, a critical alert was received and a threshold of 80 90 95 and an alert will only be triggered if you have 20 consecutive polls that fall within this range. Now the next step would be to check on the RAW DATA tab to determine if this condition was met.
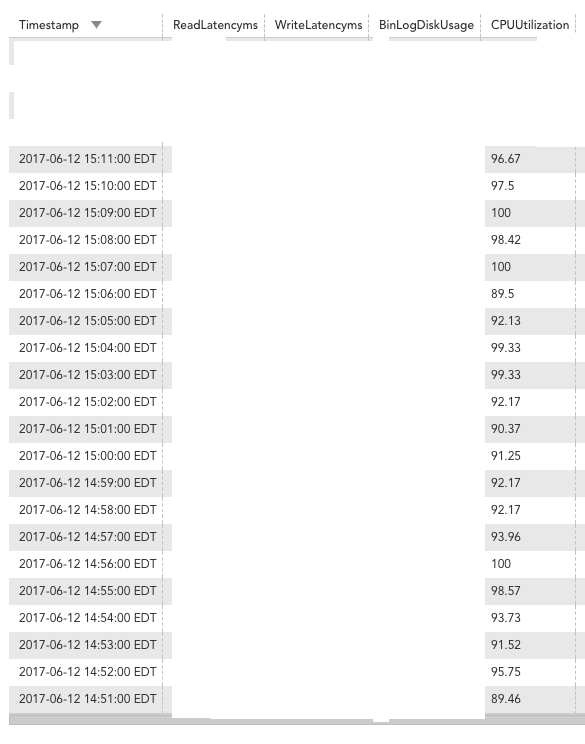
Judging from the raw data above if you look at the values all the 20 polls have met the threshold level of 80 90 95, but to determine the level of the alert it would be the last poll since the last poll was 96.67 will falls to the range of a critical alert thus a critical alert was send.
3) Checking on delivery
The last process is to check the alert rule and escalation chain to see if it was applied to the correct rule and escalation chain.
To do so you can go the alert tuning tab and check on the alert routing for that particular instance and datapoint.
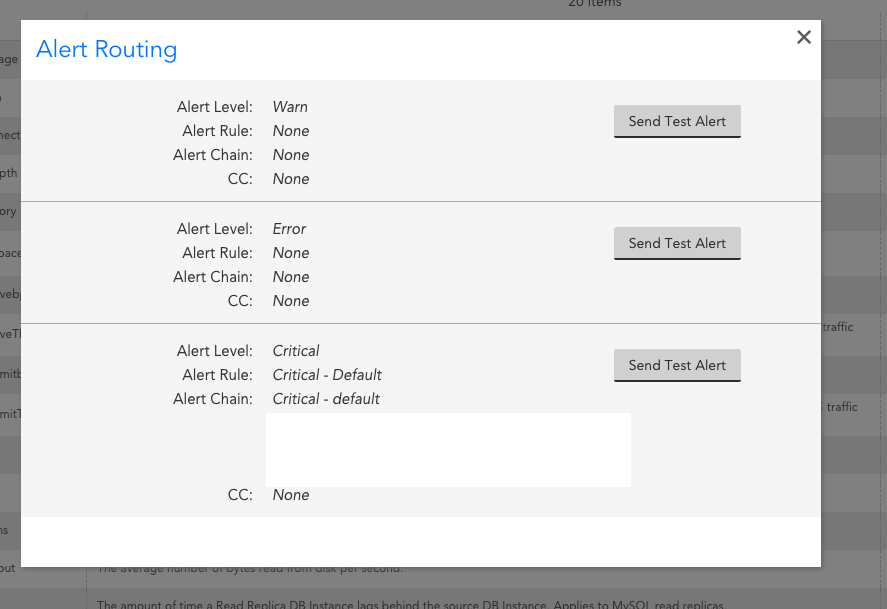
Here you can see that the Alert Rule applied is Critical - Default and the Alert Chain/Escalation Chain is Critical - Default. Under the Alert Chain is the list of email address that will receive a notification, when the threshold is met.