Forum Discussion

bala's avatar
9 years ago

Adding SDTs to healthchecks under another healthcheck

I would like to know if it is possible to add an SDT to a health check nested under another health check in LogicMonitor.

How can I find out the host id of one of the healthchecks so that I can add an SDT using a web URL like, 
https://appfolio.logicmonitor.com/santaba/rpc/setHostSDT?hostId=<host_id_here>&id=0&type=1&year=2016&month=5&day=3&hour=6&minute=30&endYear=2016&endMonth=5&endDay=3&endHour=6&endMinute=45

  • Sarah_Terry's avatar
    Sarah_Terry
    Icon for Product Manager rankProduct Manager

    The device id can be identified by first selecting the device in the device tree, and then selecting the 'focus on the selected node' option at the top right of the device tree.  After focusing, the device id will be displayed in the URL as /-groupId-d-deviceId.

    Can you explain more about what level you want to set an SDT at?  Maybe an example?  You can use our RPC API to SDT a group, device, a specific datasource for a device, an instance of a datasource or an instance group.

  • Hi Sarah,
    Thank you for the response. In the attachment to this message, you can see that we have a couple of healthchecks under the cluster health check titled "screening II cluster". I am able to find the host id for screening II cluster and add an SDT using the API. However, in a case where I need to add an SDT on a health check nested under this one, like  "Appfolio Screenings NBD criminal", I am not able to use the same API to extract the host id for "Appfolio Screenings NBD criminal". How can I extract the host id for "Appfolio Screenings NBD criminal" or "Appfolio Screenings NBD Eviction"?


  • Sarah_Terry's avatar
    Sarah_Terry
    Icon for Product Manager rankProduct Manager

    It looks like you'd like to set SDTs at the datasource level.  You can use the setHostDataSourceSDT RPC to do this.  The API request syntax for your account should be:

    https://appfolio.logicmonitor.com/santaba/rpc/setHostDataSourceSDT?dataSourceId=<datasource_id_here>&id=0&type=1&year=2016&month=5&day=3&hour=6&minute=30&endYear=2016&endMonth=5&endDay=3&endHour=6&endMinute=45
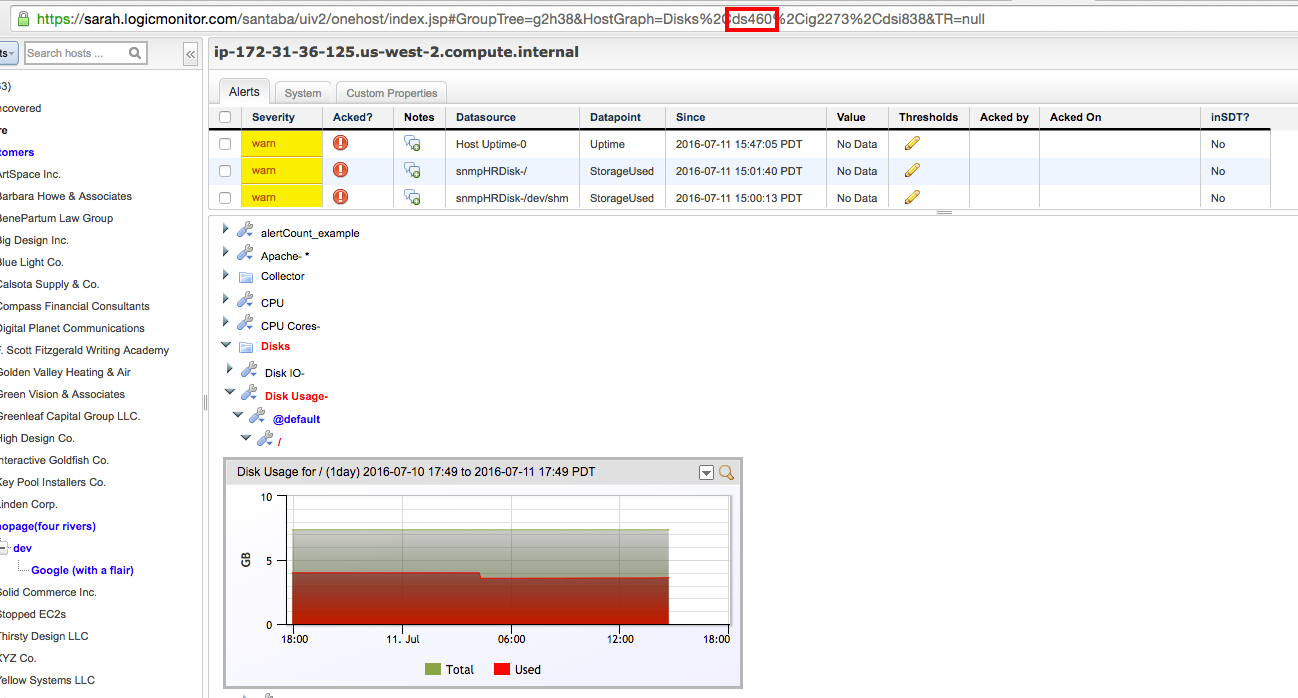
    In the Old UI, drilling down to a graph for a particular datasource will display the datasource Id in the URL.  For example, see the attached image.

    In the New UI, we do not display datasource Id.  You can, however, use our API to get datasource Id: https://www.logicmonitor.com/support/rpc-api-developers-guide/manage-devices/get-the-datasource-instances-for-a-device/