Forum Discussion
7 Replies
Replies have been turned off for this discussion
The newbie is back: Earlier this week I was watching the April 1, 2020 LM office hours and they talked about dashboard tokens (in this case, their use case was specifically around the Palo Alto dashboard), but I didn't follow how to use the tokens to get my 20 some PA firewalls to be monitored by this dashboard? (If too specific of a question, I can contact support directly) I.E. my Palo Alto Networks dashboard says "Group not found" or "instance not found" on each item.
It seems one needs to create a group or something and then assign that group as the value in the DefaultResource dashboard token or whatever, but the video didn't say how to create the group. It's probably something easy, or may be covered in the upcoming event for newcomers? Anonymous
This is definitely something we will cover in the upcoming a href="https://communities.logicmonitor.com/topic/5916-08-july-2020-logicmonitor-basics-webinar/" rel="">Basics Webinar. However, if we don't cover it in enough detail, you can also bring it up at the a href="https://communities.logicmonitor.com/topic/5917-15-july-2020-logicmonitor-basics-office-hours/" rel="">July 15 Office Hours.
In the meantime, let me know if this gets you moving:
Haven't looked at that particular dashboard, but the concept is pretty generic. The dashboard widgets are likely configured to filter by group based on the token ##DefaultResourceGroup##. You could verify this by viewing the settings for one of the widgets on the dashboard (down arrow in top right of widget then configure). You should see the token referenced somewhere in the widget. In order for the widgets to work, the token must have a value. You do that at the dashboard level. Open the dashboard settings page by clicking the down arrow in the top right of the dashboard and click manage. You'll see any tokens configured at the bottom of that dialog:
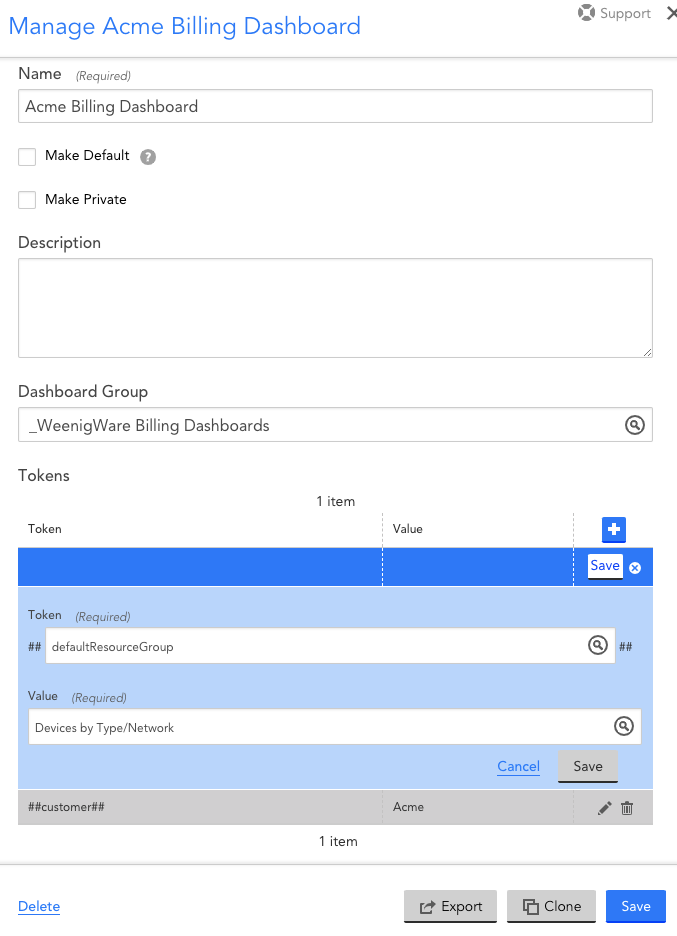
If it doesn't exist, just hit the plus sign and create it. You'll need to give it the value of a group containing the devices you want included in this dashboard.
Since it's for Palo Alto, you'll want to find or create a group on the "Resources" page containing them. There is possibly already one under /Devices By Type/ that contains them. If not, you can create a new dynamic group under Devices By Type (or under any group you want) to contain them. I recommend doing it with a dynamic group. This will ensure that as new PAs get added into monitoring, they'll get included in the group and dashboard automatically. It looks like there's a standard system category called "PaloAlto", which means you could use `hasCategory("PaloAlto")` as the rule to automatically populate the group.
FYI, the PaloAlto category gets created during initial discovery by a sysOID map, meaning that you'll need to have LM poll the PA via SNMP so it will set the system category automatically. If you don't want to do that, you would have to set the category manually on each device.
Great! I'll take a look. Thanks for the response.
Creating the dynamic group was the key. Dashboard is now populating as expected. Thanks!
- Anonymous
Awesome!
P.S. I also added the condition to exclude the Panorama management device via this custom query:
hasCategory("PaloAlto") and (auto.endpoint.model!="Panorama")
There might be a better property to query, but did what i needed it to do.
- Anonymous
Exactly what I would do. FYI, the parenthesis around the second term shouldn't be strictly needed. It also helps with readability to put spaces between the property name the not-equals (!=) operator and the term. Just my personal preference though as it works either way.