Where Expertise Unites, Solutions Ignite!
Access the Welcome Guide, FAQs, Quick Start resources, and community news to begin your LogicMonitor journey with confidence.
Learn moreExplore product guidance, best practices, and release notes, and access learning resources and skill badges in the LM Academy.
Learn moreConnect through events, user groups, and community programs to share experiences and learn alongside other LogicMonitor users.
Learn moreFilter by:
Product
The Dynamic Thresholds Deep Dive is an advanced session designed to help LogicMonitor users move beyond static alerting and implement smarter, behavior-based thresholds. In this session, you’ll learn how Dynamic Thresholds analyzes historical data to automatically establish baselines, reduce alert noise, and improve signal accuracy across your environment. We’ll walk through how to enable and tune Dynamic Thresholds, interpret their behavior, and apply best practices to ensure meaningful, actionable alerts. Through live demonstrations and real-world use cases, this Deep Dive focuses on when and where Dynamic Thresholds provide the most value, common pitfalls to avoid, and how to align thresholding strategies with operational goals. By the end, you’ll be equipped to confidently implement Dynamic Thresholds to create a more proactive and efficient monitoring strategy. In this session, you’ll learn how to: How Dynamic Thresholds work and when to use them How to configure and tune thresholds for accurate alerting How to interpret behavior and reduce alert noise Real-world use cases and best practices for implementation Who should attend: 👉 LM Academy Deep Dives is designed for existing LogicMonitor users—including practitioners, administrators, and power users—who want to deepen their expertise in Envision and Edwin by learning how to apply advanced features and workflows more effectively in real-world environments.
Product Hub
May 13
Product
The Dynamic Thresholds Deep Dive is an advanced session designed to help LogicMonitor users move beyond static alerting and implement smarter, behavior-based thresholds. In this session, you’ll learn how Dynamic Thresholds analyzes historical data to automatically establish baselines, reduce alert noise, and improve signal accuracy across your environment. We’ll walk through how to enable and tune Dynamic Thresholds, interpret their behavior, and apply best practices to ensure meaningful, actionable alerts. Through live demonstrations and real-world use cases, this Deep Dive focuses on when and where Dynamic Thresholds provide the most value, common pitfalls to avoid, and how to align thresholding strategies with operational goals. By the end, you’ll be equipped to confidently implement Dynamic Thresholds to create a more proactive and efficient monitoring strategy. In this session, you’ll learn how to: How Dynamic Thresholds work and when to use them How to configure and tune thresholds for accurate alerting How to interpret behavior and reduce alert noise Real-world use cases and best practices for implementation Who should attend: 👉 LM Academy Deep Dives is designed for existing LogicMonitor users—including practitioners, administrators, and power users—who want to deepen their expertise in Envision and Edwin by learning how to apply advanced features and workflows more effectively in real-world environments.
Product Hub
May 13
Product
Cloud cost management should be part of your operational workflow, not a separate exercise. In this session, you’ll see how LogicMonitor helps practitioners bring cost visibility and budget governance directly into the tools and processes they already use every day. We’ll showcase the latest Cost Optimization innovations, including embedded cost visibility in Resource Explorer and Cloud Budget Alerts in LM Core. You’ll learn how to analyze historical cost data alongside infrastructure telemetry, investigate changes in spend more quickly, and act on projected budget risk before costs spiral. What you’ll learn How to view resource and group-level historical cost data in context with infrastructure health How to pivot directly into Cost Analysis for deeper investigation How Cloud Budget Alerts help detect projected overspend earlier How to unify cost governance with existing monitoring and alerting workflows How to improve accountability and decision-making across cloud teams Who should attend 👉 Designed for cloud platform engineers, FinOps practitioners, and SRE or operations teams, this session will highlight how to move from cost visibility to action across multi-cloud environments. Why attend By bringing financial governance into operational workflows, these updates help teams validate cost impact faster, reduce fragmented reporting, and manage cloud spend with greater confidence.
Product Hub
May 19
Product
The Edwin AI Use Case Deep Dive is an advanced session designed to help LogicMonitor users understand how Edwin AI can support faster investigation, clearer incident context, and more efficient operations across complex environments. In this session, you’ll learn how Edwin AI helps teams move from reactive alert triage to guided, AI-assisted investigation. We’ll explore how Edwin analyzes monitoring data, surfaces relevant context, identifies patterns, and helps operators understand what changed, what is impacted, and where to focus next. Through practical examples and real-world operational scenarios, this Deep Dive focuses on where Edwin AI provides the most value, how to incorporate it into existing workflows, and how to use it to reduce investigation time, improve alert understanding, and support more proactive incident response. By the end, you’ll be equipped to confidently apply Edwin AI to common operational use cases and strengthen your team’s monitoring and response strategy. In this session, you’ll learn how to: Understand how Edwin AI supports AI-assisted investigation and incident response Use Edwin AI to surface context, patterns, and likely areas of impact Apply Edwin AI to common operational use cases across monitored environments Reduce alert noise and investigation time by focusing on the most relevant signals Incorporate Edwin AI into existing LogicMonitor workflows and operational practices Identify best practices for using Edwin AI effectively in real-world environments Who should attend: 👉 LM Academy Deep Dives are designed for existing LogicMonitor users—including practitioners, administrators, and power users—who want to deepen their expertise in LM Envision and Edwin AI by learning how to apply advanced features and workflows more effectively in real-world environments.
Product Hub
May 27
Product
The Edwin AI Use Case Deep Dive is an advanced session designed to help LogicMonitor users understand how Edwin AI can support faster investigation, clearer incident context, and more efficient operations across complex environments. In this session, you’ll learn how Edwin AI helps teams move from reactive alert triage to guided, AI-assisted investigation. We’ll explore how Edwin analyzes monitoring data, surfaces relevant context, identifies patterns, and helps operators understand what changed, what is impacted, and where to focus next. Through practical examples and real-world operational scenarios, this Deep Dive focuses on where Edwin AI provides the most value, how to incorporate it into existing workflows, and how to use it to reduce investigation time, improve alert understanding, and support more proactive incident response. By the end, you’ll be equipped to confidently apply Edwin AI to common operational use cases and strengthen your team’s monitoring and response strategy. In this session, you’ll learn how to: Understand how Edwin AI supports AI-assisted investigation and incident response Use Edwin AI to surface context, patterns, and likely areas of impact Apply Edwin AI to common operational use cases across monitored environments Reduce alert noise and investigation time by focusing on the most relevant signals Incorporate Edwin AI into existing LogicMonitor workflows and operational practices Identify best practices for using Edwin AI effectively in real-world environments Who should attend: 👉 LM Academy Deep Dives are designed for existing LogicMonitor users—including practitioners, administrators, and power users—who want to deepen their expertise in LM Envision and Edwin AI by learning how to apply advanced features and workflows more effectively in real-world environments.
Product Hub
May 27
User Group
Join us for a User Group Dinner in Chicago on May 27th to gather with LogicMonitor customers and share insights and best practices, all while enjoying a nice dinner hosted by the LM Community. This in-person gathering is an informal dinner with a flexible agenda designed for our users to: Network with other LM Community members and users Learn about the latest use cases and best practices Enjoy a nice dinner hosted by our LM Community team and friends Restaurant: The Foxtail on the Lake - 1177 Howard Avenue, Des Plaines, IL 60018 We hope to see you there!
Virtual User Group | AMER East
May 27
Product
The Dynamic Service Insights Deep Dive is an advanced session designed to help LogicMonitor users move beyond device-by-device monitoring and understand service health from a broader, business-aligned perspective. In this session, you’ll learn how Dynamic Service Insights helps teams visualize, analyze, and manage the relationships between monitored resources, dependencies, and the services they support. We’ll explore how service insights can help identify impact, prioritize investigation, and give teams a clearer view of how infrastructure and application issues affect overall service performance. Through live demonstrations and real-world use cases, this Deep Dive focuses on when and where Dynamic Service Insights provides the most value, how to interpret service-level views, and how to align monitoring strategies with operational and business outcomes. By the end, you’ll be equipped to use Dynamic Service Insights to improve visibility, accelerate troubleshooting, and support more proactive service management. In this session, you’ll learn how to: Understand how Dynamic Service Insights works and when to use it Visualize relationships between monitored resources, dependencies, and services Interpret service health and impact across complex environments Use service-level context to prioritize investigation and response Apply real-world use cases and best practices for implementation Who should attend: 👉 LM Academy Deep Dives are designed for existing LogicMonitor users—including practitioners, administrators, and power users—who want to deepen their expertise in Envision and Edwin AI by learning how to apply advanced features and workflows more effectively in real-world environments.
Product Hub
Jun 10
Product
The Dynamic Service Insights Deep Dive is an advanced session designed to help LogicMonitor users move beyond device-by-device monitoring and understand service health from a broader, business-aligned perspective. In this session, you’ll learn how Dynamic Service Insights helps teams visualize, analyze, and manage the relationships between monitored resources, dependencies, and the services they support. We’ll explore how service insights can help identify impact, prioritize investigation, and give teams a clearer view of how infrastructure and application issues affect overall service performance. Through live demonstrations and real-world use cases, this Deep Dive focuses on when and where Dynamic Service Insights provides the most value, how to interpret service-level views, and how to align monitoring strategies with operational and business outcomes. By the end, you’ll be equipped to use Dynamic Service Insights to improve visibility, accelerate troubleshooting, and support more proactive service management. In this session, you’ll learn how to: Understand how Dynamic Service Insights works and when to use it Visualize relationships between monitored resources, dependencies, and services Interpret service health and impact across complex environments Use service-level context to prioritize investigation and response Apply real-world use cases and best practices for implementation Who should attend: 👉 LM Academy Deep Dives are designed for existing LogicMonitor users—including practitioners, administrators, and power users—who want to deepen their expertise in Envision and Edwin AI by learning how to apply advanced features and workflows more effectively in real-world environments.
Product Hub
Jun 10
Product
Manual remediation slows teams down, increases alert fatigue, and keeps engineers stuck in repetitive troubleshooting loops. In this Product Power Hour, we’ll show how LogicMonitor Automated Remediation helps teams move from alert detection to guided diagnostics and action, so known issues can be investigated, escalated, or resolved faster with less manual effort. Join LogicMonitor product experts for a practical walkthrough of how automated diagnostics and remediation fit into modern IT operations workflows. We’ll explore how alert-driven automation can help teams capture just-in-time diagnostic data, reduce repetitive toil, and execute remediation actions through native workflows and supported automation platforms such as Ansible. We’ll also cover how these capabilities support the larger shift toward proactive, self-healing operations. This session is built for technical practitioners who want to operationalize remediation safely and effectively. Expect a technical overview, workflow examples, live Q&A, and guidance on where Automated Remediation can create the most immediate value in your environment. What you’ll learn How Automated Remediation helps teams move from alert noise to faster action Where diagnostics, remediation actions, alert workflows, and escalation processes fit together Practical use cases for resolving common issues through alert-driven automation How remediation workflows can reduce manual troubleshooting and improve MTTR Guardrails and considerations for implementing automation safely across IT operations Who should attend 👉 Designed for IT operations teams, infrastructure engineers, SREs, network teams, MSP operators, and technical leaders looking to reduce manual remediation work and build more proactive operational workflows.
Product Hub
Jun 17
Product
The Edwin AI Agent Deep Dive is an advanced session designed to help LogicMonitor users understand how Edwin AI Agents can support faster, more focused investigation and help teams take action across complex monitored environments. In this session, you’ll learn how Edwin AI Agents help operators move beyond manual triage by guiding investigation workflows, surfacing relevant context, and helping identify where attention is needed most. We’ll explore how agents can assist with understanding incidents, correlating signals, interpreting operational data, and supporting more consistent response processes. Through practical examples and real-world operational scenarios, this Deep Dive focuses on how Edwin AI Agents fit into existing LogicMonitor workflows, where they provide the most value, and how teams can use them to reduce investigation effort, improve operational consistency, and accelerate time to resolution. By the end, you’ll be equipped to confidently apply Edwin AI Agents to common monitoring and incident response use cases. In this session, you’ll learn how to: Understand what Edwin AI Agents are and how they support AI-assisted operations Use agents to guide investigation and surface relevant operational context Apply Edwin AI Agents to common incident response and troubleshooting workflows Identify patterns, impacted areas, and likely next steps more efficiently Incorporate Edwin AI Agents into existing LogicMonitor workflows and team practices Recognize best practices for using agents effectively in real-world environments Who should attend: 👉 LM Academy Deep Dives are designed for existing LogicMonitor users—including practitioners, administrators, and power users—who want to deepen their expertise in LM Envision and Edwin AI by learning how to apply advanced features and workflows more effectively in real-world environments.
Product Hub
Jun 24
Product
The Edwin AI Agent Deep Dive is an advanced session designed to help LogicMonitor users understand how Edwin AI Agents can support faster, more focused investigation and help teams take action across complex monitored environments. In this session, you’ll learn how Edwin AI Agents help operators move beyond manual triage by guiding investigation workflows, surfacing relevant context, and helping identify where attention is needed most. We’ll explore how agents can assist with understanding incidents, correlating signals, interpreting operational data, and supporting more consistent response processes. Through practical examples and real-world operational scenarios, this Deep Dive focuses on how Edwin AI Agents fit into existing LogicMonitor workflows, where they provide the most value, and how teams can use them to reduce investigation effort, improve operational consistency, and accelerate time to resolution. By the end, you’ll be equipped to confidently apply Edwin AI Agents to common monitoring and incident response use cases. In this session, you’ll learn how to: Understand what Edwin AI Agents are and how they support AI-assisted operations Use agents to guide investigation and surface relevant operational context Apply Edwin AI Agents to common incident response and troubleshooting workflows Identify patterns, impacted areas, and likely next steps more efficiently Incorporate Edwin AI Agents into existing LogicMonitor workflows and team practices Recognize best practices for using agents effectively in real-world environments Who should attend: 👉 LM Academy Deep Dives are designed for existing LogicMonitor users—including practitioners, administrators, and power users—who want to deepen their expertise in LM Envision and Edwin AI by learning how to apply advanced features and workflows more effectively in real-world environments.
Product Hub
Jun 24
Product
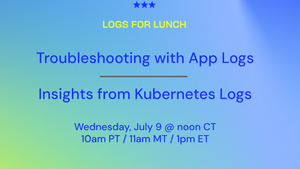
The Log Ingestion Deep Dive is an advanced session designed to help LogicMonitor users expand their observability strategy by bringing log data into the same operational context as metrics, alerts, and monitored resources. In this session, you’ll learn how Log Ingestion helps teams collect, centralize, and analyze logs from across their environments to improve troubleshooting, investigation, and incident response. We’ll explore how log data can provide deeper context around system behavior, application activity, infrastructure events, and operational changes that may not be visible through metrics alone. Through live demonstrations and real-world use cases, this Deep Dive focuses on when and where log ingestion provides the most value, how to structure and search log data effectively, and how to use logs alongside monitoring data to accelerate root cause analysis. By the end, you’ll be equipped to use Log Ingestion to improve visibility, strengthen troubleshooting workflows, and support a more complete observability strategy. In this session, you’ll learn how to: Understand how Log Ingestion works and when to use it Collect and centralize logs from key systems, applications, and infrastructure Search, filter, and analyze logs to support investigation workflows Use log data alongside metrics, alerts, and monitored resources for deeper context Identify patterns, anomalies, and operational events that support faster troubleshooting Apply real-world use cases and best practices for implementation Who should attend: 👉 LM Academy Deep Dives are designed for existing LogicMonitor users—including practitioners, administrators, and power users—who want to deepen their expertise in LM Envision and Edwin AI by learning how to apply advanced features and workflows more effectively in real-world environments.
Product Hub
Jul 8
Product
The Log Ingestion Deep Dive is an advanced session designed to help LogicMonitor users expand their observability strategy by bringing log data into the same operational context as metrics, alerts, and monitored resources. In this session, you’ll learn how Log Ingestion helps teams collect, centralize, and analyze logs from across their environments to improve troubleshooting, investigation, and incident response. We’ll explore how log data can provide deeper context around system behavior, application activity, infrastructure events, and operational changes that may not be visible through metrics alone. Through live demonstrations and real-world use cases, this Deep Dive focuses on when and where log ingestion provides the most value, how to structure and search log data effectively, and how to use logs alongside monitoring data to accelerate root cause analysis. By the end, you’ll be equipped to use Log Ingestion to improve visibility, strengthen troubleshooting workflows, and support a more complete observability strategy. In this session, you’ll learn how to: Understand how Log Ingestion works and when to use it Collect and centralize logs from key systems, applications, and infrastructure Search, filter, and analyze logs to support investigation workflows Use log data alongside metrics, alerts, and monitored resources for deeper context Identify patterns, anomalies, and operational events that support faster troubleshooting Apply real-world use cases and best practices for implementation Who should attend: 👉 LM Academy Deep Dives are designed for existing LogicMonitor users—including practitioners, administrators, and power users—who want to deepen their expertise in LM Envision and Edwin AI by learning how to apply advanced features and workflows more effectively in real-world environments.
Product Hub
Jul 8
Product
The Edwin AI Dashboards Deep Dive is an advanced session designed to help LogicMonitor users understand how Edwin AI Dashboards can provide clearer visibility into operational health, incident context, and AI-assisted insights across complex monitored environments. In this session, you’ll learn how Edwin AI Dashboards help teams move beyond scattered views and manual analysis by bringing relevant signals, patterns, and operational context into focused, actionable dashboards. We’ll explore how dashboards can support faster investigation, improve situational awareness, and help teams understand what is happening across services, resources, and incidents. Through practical examples and real-world operational scenarios, this Deep Dive focuses on how Edwin AI Dashboards fit into existing LogicMonitor workflows, where they provide the most value, and how teams can use them to improve visibility, prioritize response, and support more consistent decision-making. By the end, you’ll be equipped to confidently use Edwin AI Dashboards to strengthen monitoring, investigation, and operational review workflows. In this session, you’ll learn how to: Understand what Edwin AI Dashboards are and how they support AI-assisted operations Use dashboards to surface relevant operational context, trends, and insights Interpret dashboard views to improve investigation and situational awareness Apply Edwin AI Dashboards to common monitoring, incident response, and review workflows Identify patterns, impacted areas, and priority signals more efficiently Incorporate Edwin AI Dashboards into existing LogicMonitor workflows and team practices Recognize best practices for using dashboards effectively in real-world environments Who should attend: 👉 LM Academy Deep Dives are designed for existing LogicMonitor users—including practitioners, administrators, and power users—who want to deepen their expertise in LM Envision and Edwin AI by learning how to apply advanced features and workflows more effectively in real-world environments.
Product Hub
Jul 22
Product
The Edwin AI Dashboards Deep Dive is an advanced session designed to help LogicMonitor users understand how Edwin AI Dashboards can provide clearer visibility into operational health, incident context, and AI-assisted insights across complex monitored environments. In this session, you’ll learn how Edwin AI Dashboards help teams move beyond scattered views and manual analysis by bringing relevant signals, patterns, and operational context into focused, actionable dashboards. We’ll explore how dashboards can support faster investigation, improve situational awareness, and help teams understand what is happening across services, resources, and incidents. Through practical examples and real-world operational scenarios, this Deep Dive focuses on how Edwin AI Dashboards fit into existing LogicMonitor workflows, where they provide the most value, and how teams can use them to improve visibility, prioritize response, and support more consistent decision-making. By the end, you’ll be equipped to confidently use Edwin AI Dashboards to strengthen monitoring, investigation, and operational review workflows. In this session, you’ll learn how to: Understand what Edwin AI Dashboards are and how they support AI-assisted operations Use dashboards to surface relevant operational context, trends, and insights Interpret dashboard views to improve investigation and situational awareness Apply Edwin AI Dashboards to common monitoring, incident response, and review workflows Identify patterns, impacted areas, and priority signals more efficiently Incorporate Edwin AI Dashboards into existing LogicMonitor workflows and team practices Recognize best practices for using dashboards effectively in real-world environments Who should attend: 👉 LM Academy Deep Dives are designed for existing LogicMonitor users—including practitioners, administrators, and power users—who want to deepen their expertise in LM Envision and Edwin AI by learning how to apply advanced features and workflows more effectively in real-world environments.
Product Hub
Jul 22
Prevent disruptions, resolve issues faster, and safeguard critical services with the unified observability platform built for predictive, AI-powered IT operations.
Explore events