Forum Discussion

DChen's avatar
2 years ago

Monitoring Meraki WAN1 and WAN2 via API

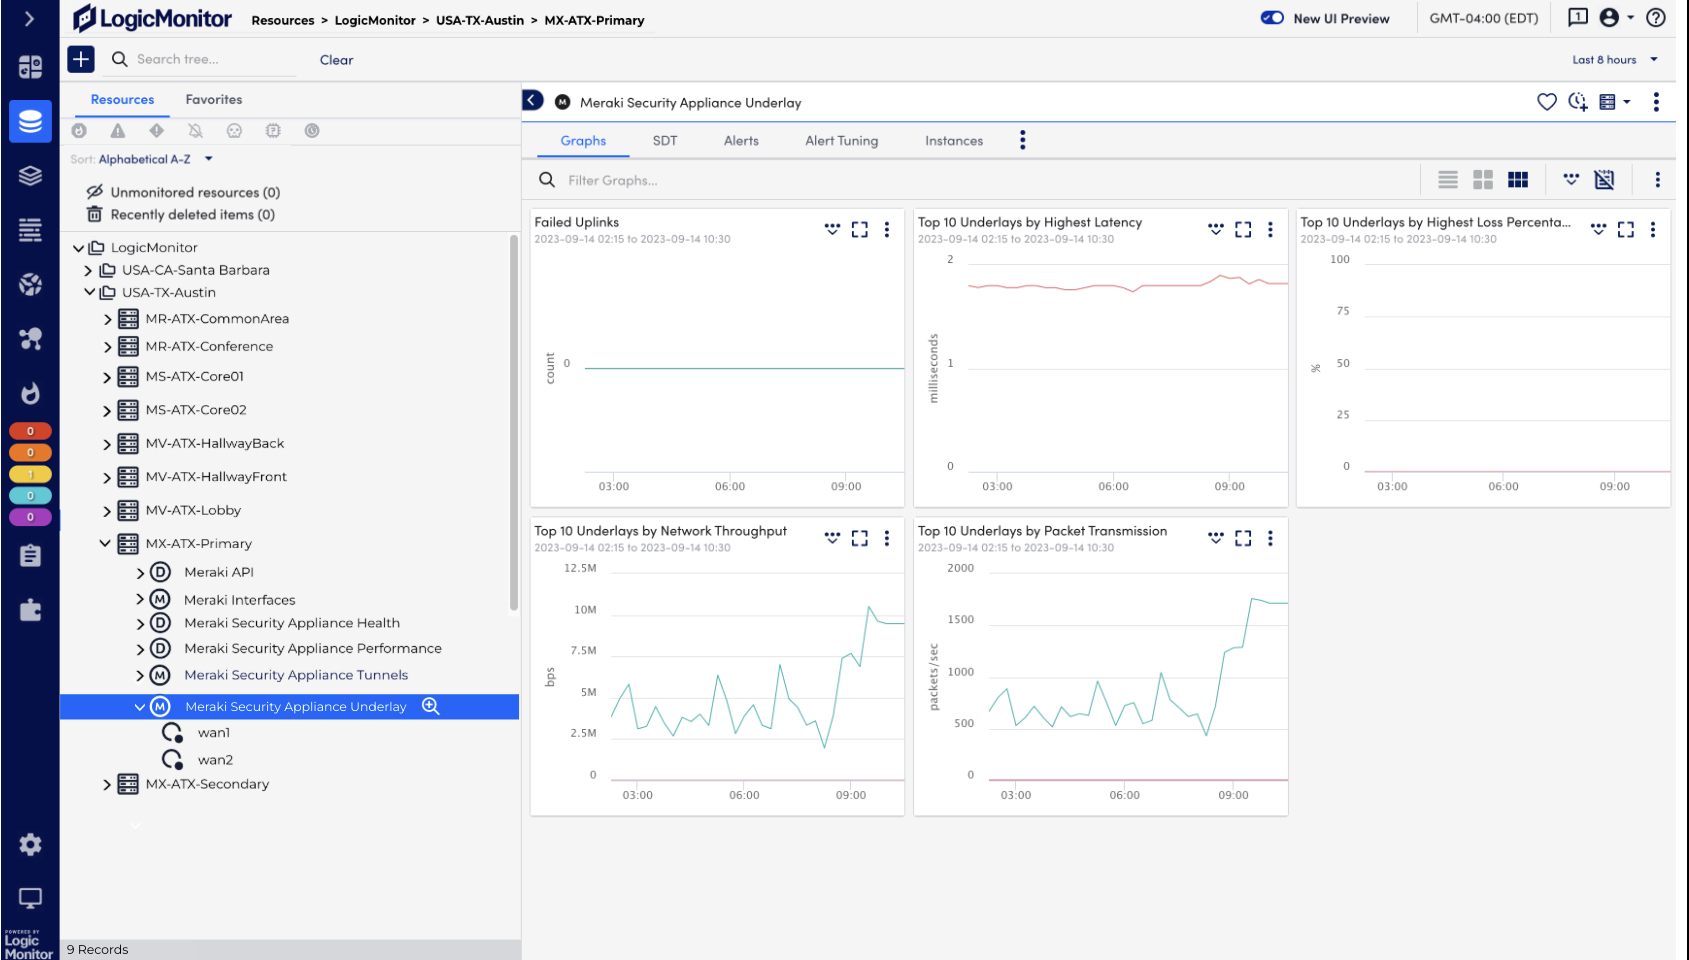
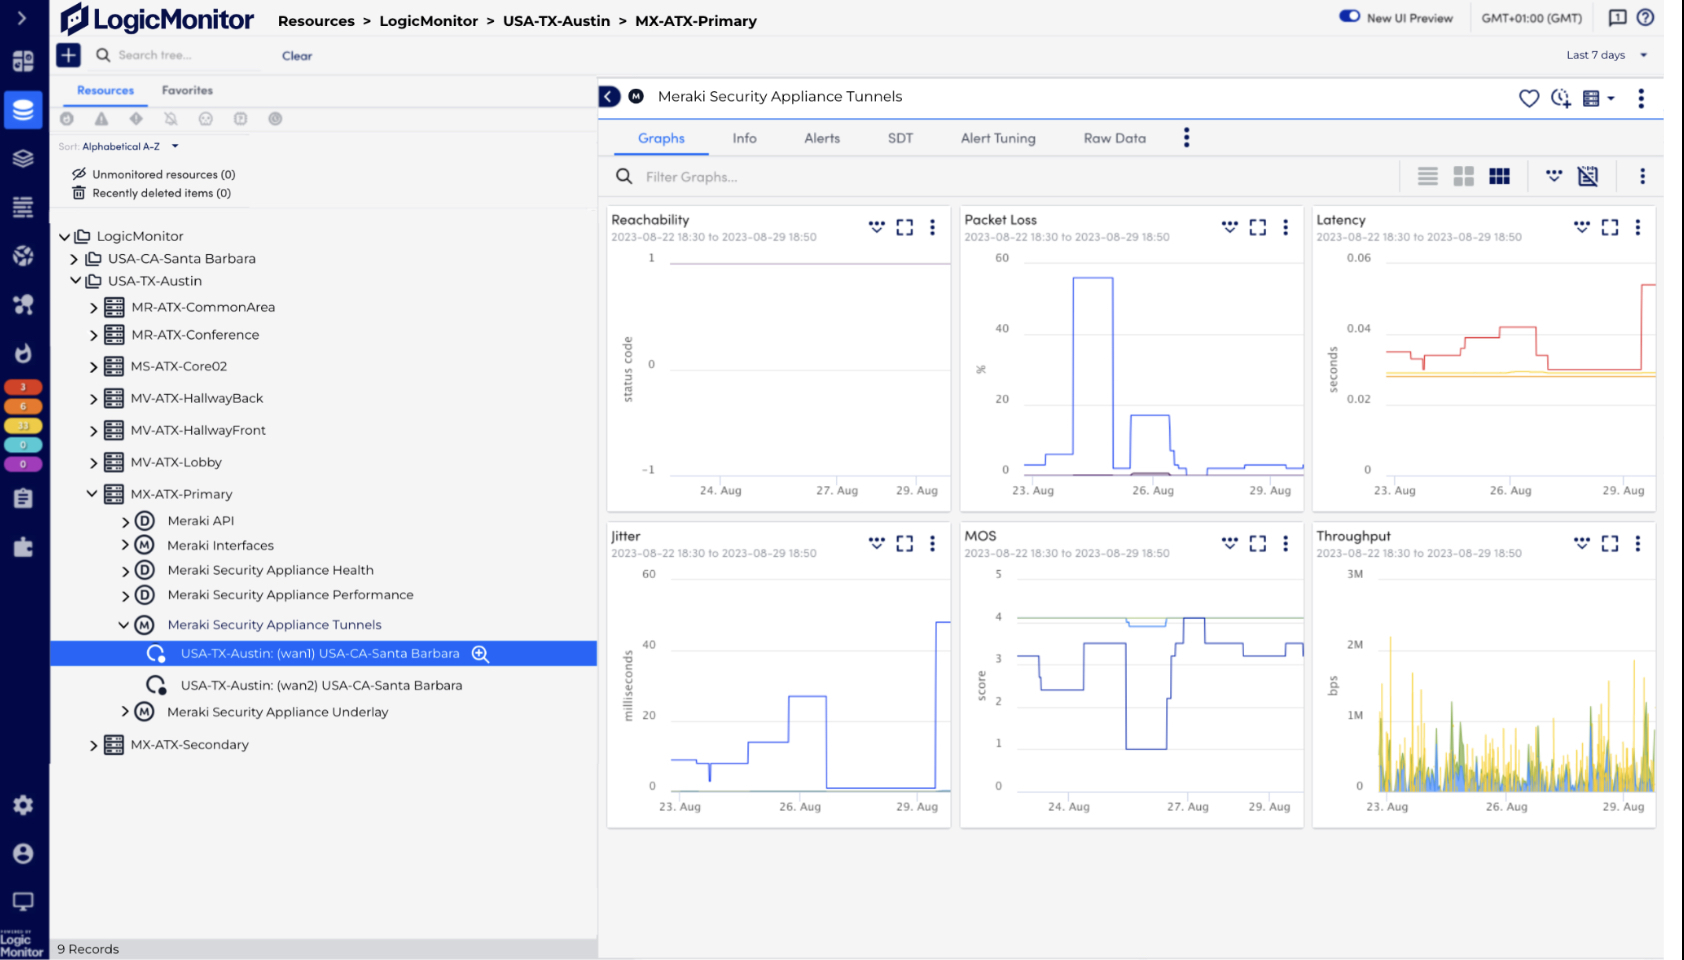
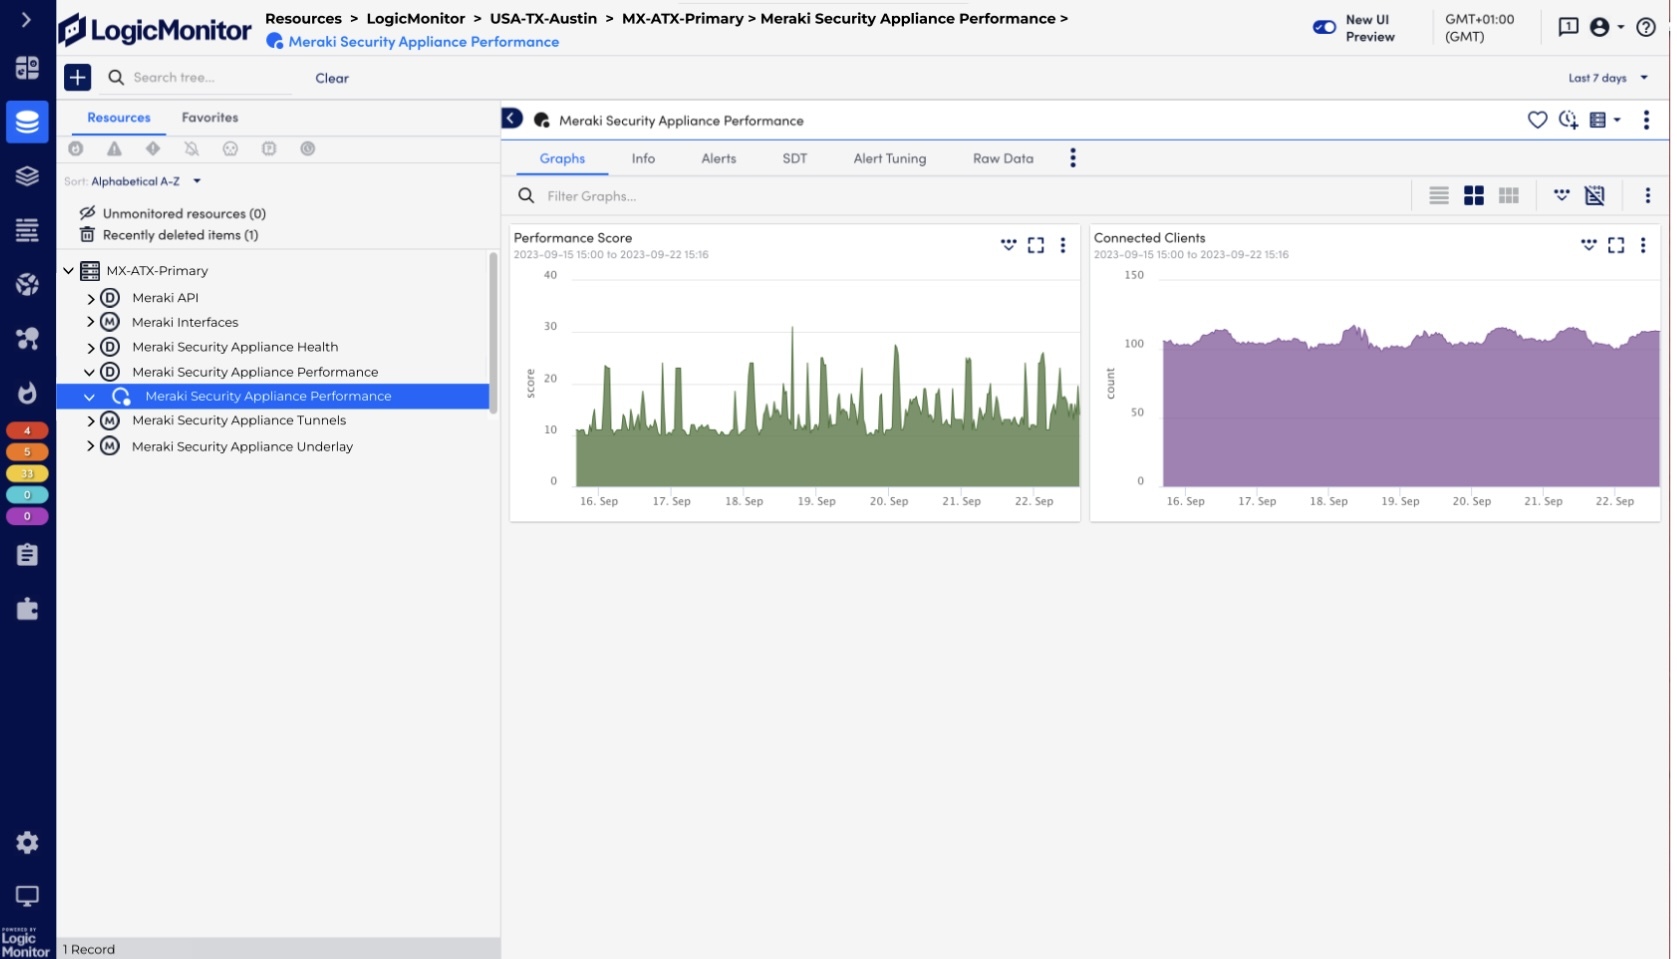
To set the stage I basically have a Meraki MX84 and have a Primary (i.e Verizon) Circuit and Secondary (i.e. AT&T) Circuit.

I want to be able to separate these and monitor them separately so that I can see when either the Primary or Secondary is down and not just the general uptime of the MX as it will still be up even if one fails.

Is this possible?

If so, does anyone have an Embedded PS Script or Groovy Script that is working?

4 Replies

  • Cisco_Meraki_SecurityAppliance_Interfaces should be tracking the individual interfaces on the MXs.

  • I am assuming you have a fix, if not use api to pull data for Wan status and then set that as an instance under your Device. and can provide more details if needed 

  • In the new Cisco Meraki package, we monitor the SD-WAN Underlay (WAN interfaces), the VPN/SD-WAN tunnels, non-routed (LAN) interfaces, the health of the MX (status and if it’s the primary or backup), and the performance (client count and performance score).
     

    Unlike the Legacy modules that apply MX-related datasources to both the Meraki Org resource (Uplink Appliance Status and Uplink loss and latency) and each Meraki Network resource (Security Appliance and Security Appliance Interfaces), the new modules apply to each discrete MX Security Appliance and do not use the Legacy Meraki Org or Meraki Network resources.


    Cisco Meraki Integrations page:

    https://www.logicmonitor.com/integrations/meraki

    New Cisco Meraki Monitoring Product Docs page:

    https://www.logicmonitor.com/support/cisco-meraki-monitoring