Getting started with Log analysis - useful queries
We at LogicMonitor want to make taking control of your log data easy for analysis, troubleshooting, and identifying trends. In this post, we will share a few helpful queries to get started with LM Logs - what devices are generating log data and easy ways to track overall usage.
In future posts, we’ll share queries to dive deeper into specific log data types. What type of queries do you want to see? Reply to this post with areas of log analysis or best practices you want.
Not up to date with LM Logs? Check out this blog post highlighting recent improvements and customer stories: A lookback at LM Logs
NOTE: Some assumptions for these queries:
- Each queries results are bound to the time picker value, adjust according to your needs
- * is a wildcard value meaning ALL which can be replaced by a Resource, Resource Group, Sub-Group, Device by Type or Meta Data value
- You may need to modify specific queries to match your LM portal
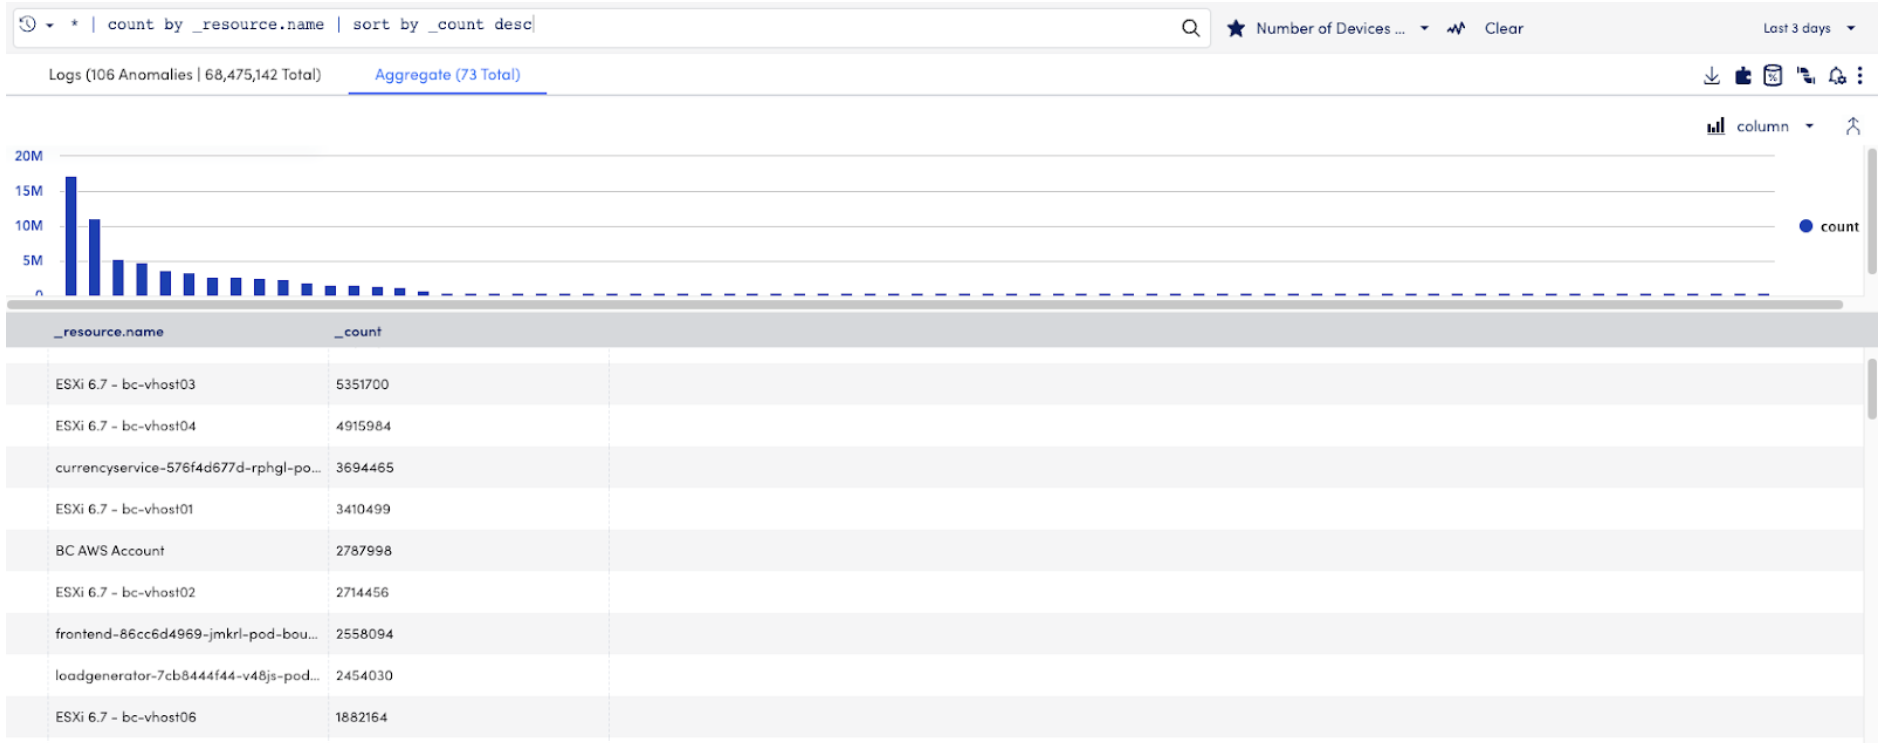
Devices Sending Logs - use this query to easily see which LM monitored devices are currently ingesting log data into your portal
| * | count by _resource.name | sort by _count desc |

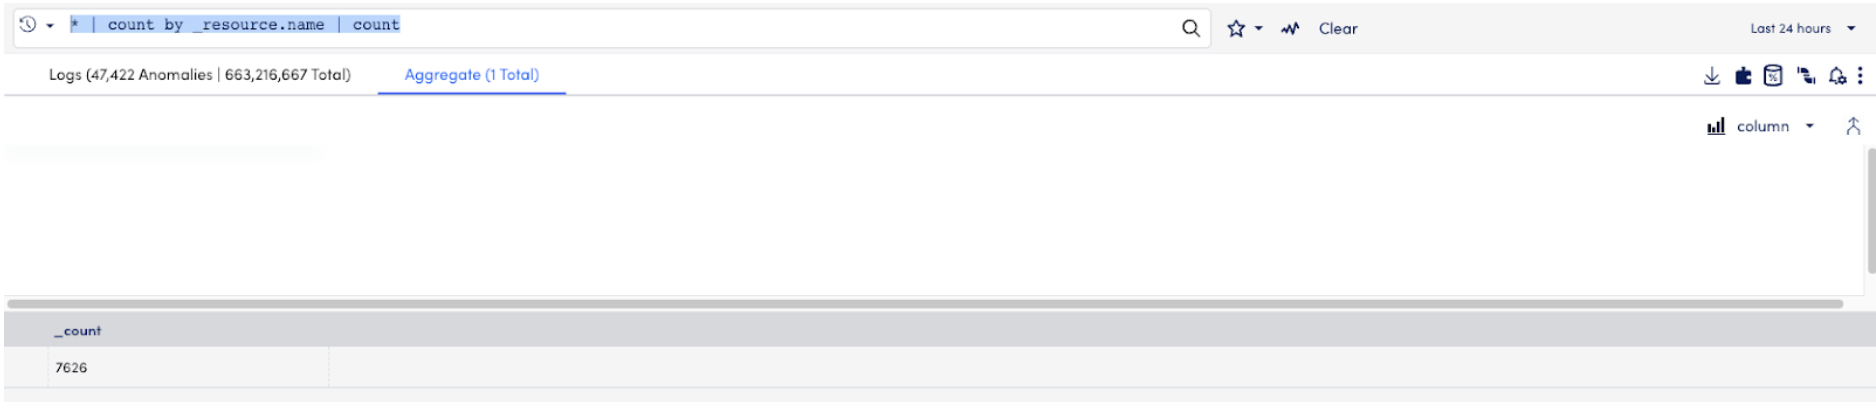
Total Number of Devices Sending Logs - the previous query showed which devices are generated logs, while this query identifies the overall number of devices
| * | count by _resource.name | count |
Total Volume by Resource Name - this query shows the total volume of log ingestion (as GB) by resource name, with the average, min, max size per message. The results are sorted by GB descending but you can modify the operators to identify your own trends.
| * | count(_size), sum(_size), max(_size), min(_size) by _resource.name | num(_sum/1000000000) as GB | num(_sum/_count) as avg_size | sort by GB desc |
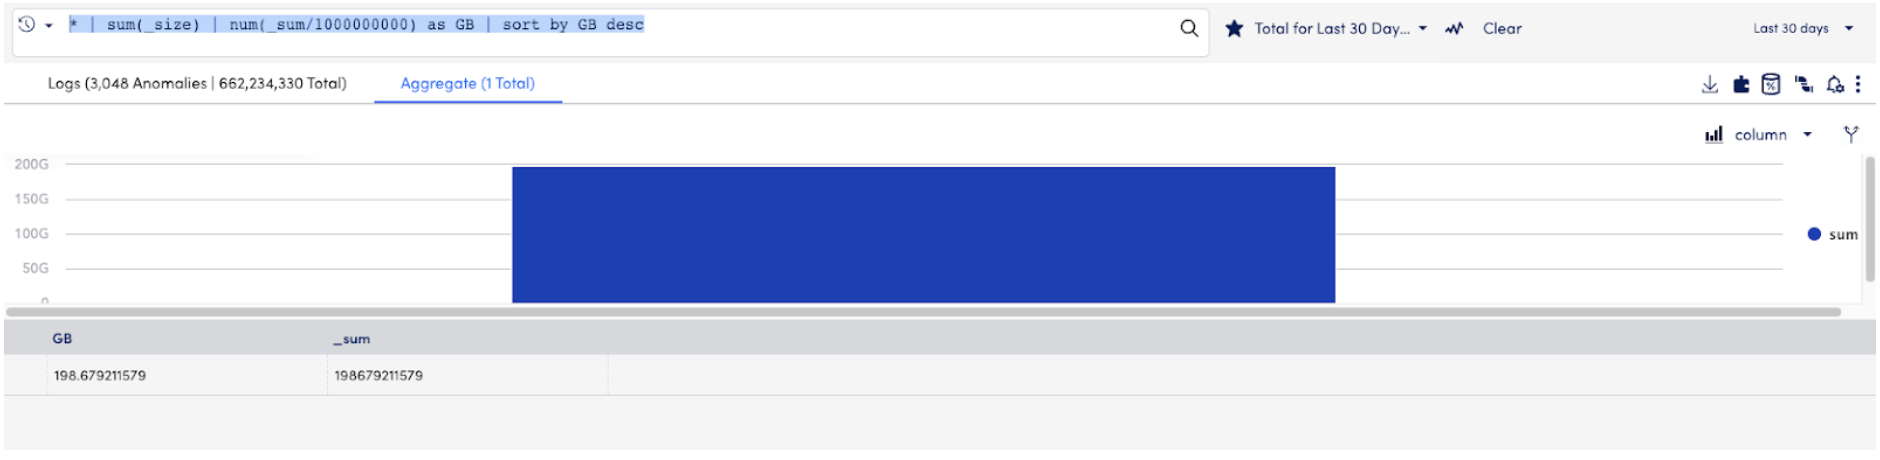
Total Log Usage - This is a helpful query to run to see your overall log usage for the entire portal
| * | sum(_size) | num(_sum/1000000000) as GB | sort by GB desc |
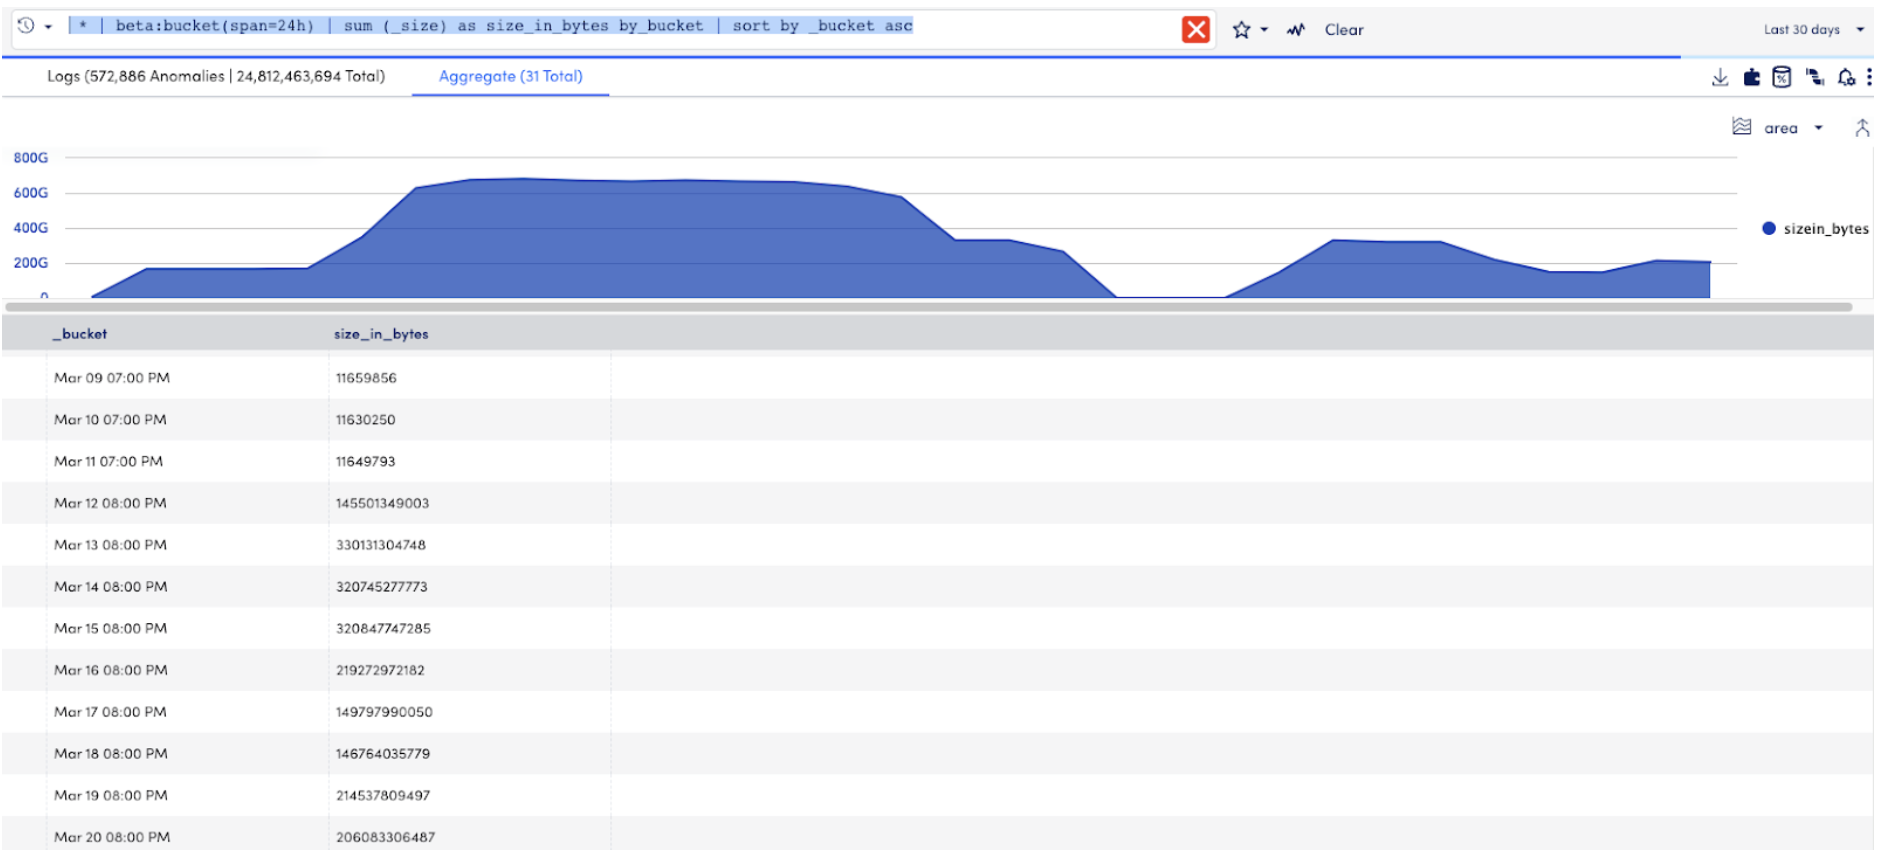
And finally, Daily Usage in Buckets - run this query to see an aggregated view of your daily log usage
| * | beta:bucket(span=24h) | sum (_size) as size_in_bytes by_bucket | num(size_in_bytes/1000000000) as GB | sort by _bucket asc |
We hope these help you get started!