Neophyte
Does anyone aware where I can find AWS cloud watch API call logs in AWS account or from LM?
Does anyone aware where I can find AWS cloud watch API call logs to collect metrics from LM account like cloud watch or cloud trail? I wanted to know how many API calls made to the aws ec2 service for a particular ec2 instance in given time to collect metrics.
@Naveenkumar Currently, LogicMonitor does not monitor the API usage in a DataSource. AWS offers CloudTrail.
https://aws.amazon.com/cloudtrail/
You could contact AWS support and see if this is something that would benefit you.if you added a device and it was being monitored you'd get at least 1 API call per device per DataSource per the polling interval.
To put it another way, if you added 100 devices you'd get 100 calls times the number of DataSources and then if you wanted to know the regularity of these calls you'd then divide by the polling interval to get the API calls per minute. This is just for the number of devices and is normal DataCollection. LogicMonitor also discovers devices and thus that discovery also accesses the API at an interval. By default, I believe this is every two hours. So you'd have a pretty flat curve with occasional spikes for Active Discovery.
To see how often a call is going to be made browse to the DataSource from Settings->DataSources-><Some AWS DataSource> then scroll through the DataSource information and find the line "Collect every" and that is how often that DataSource collects. Some are 2 minutes, some are 5 and some are only every hour.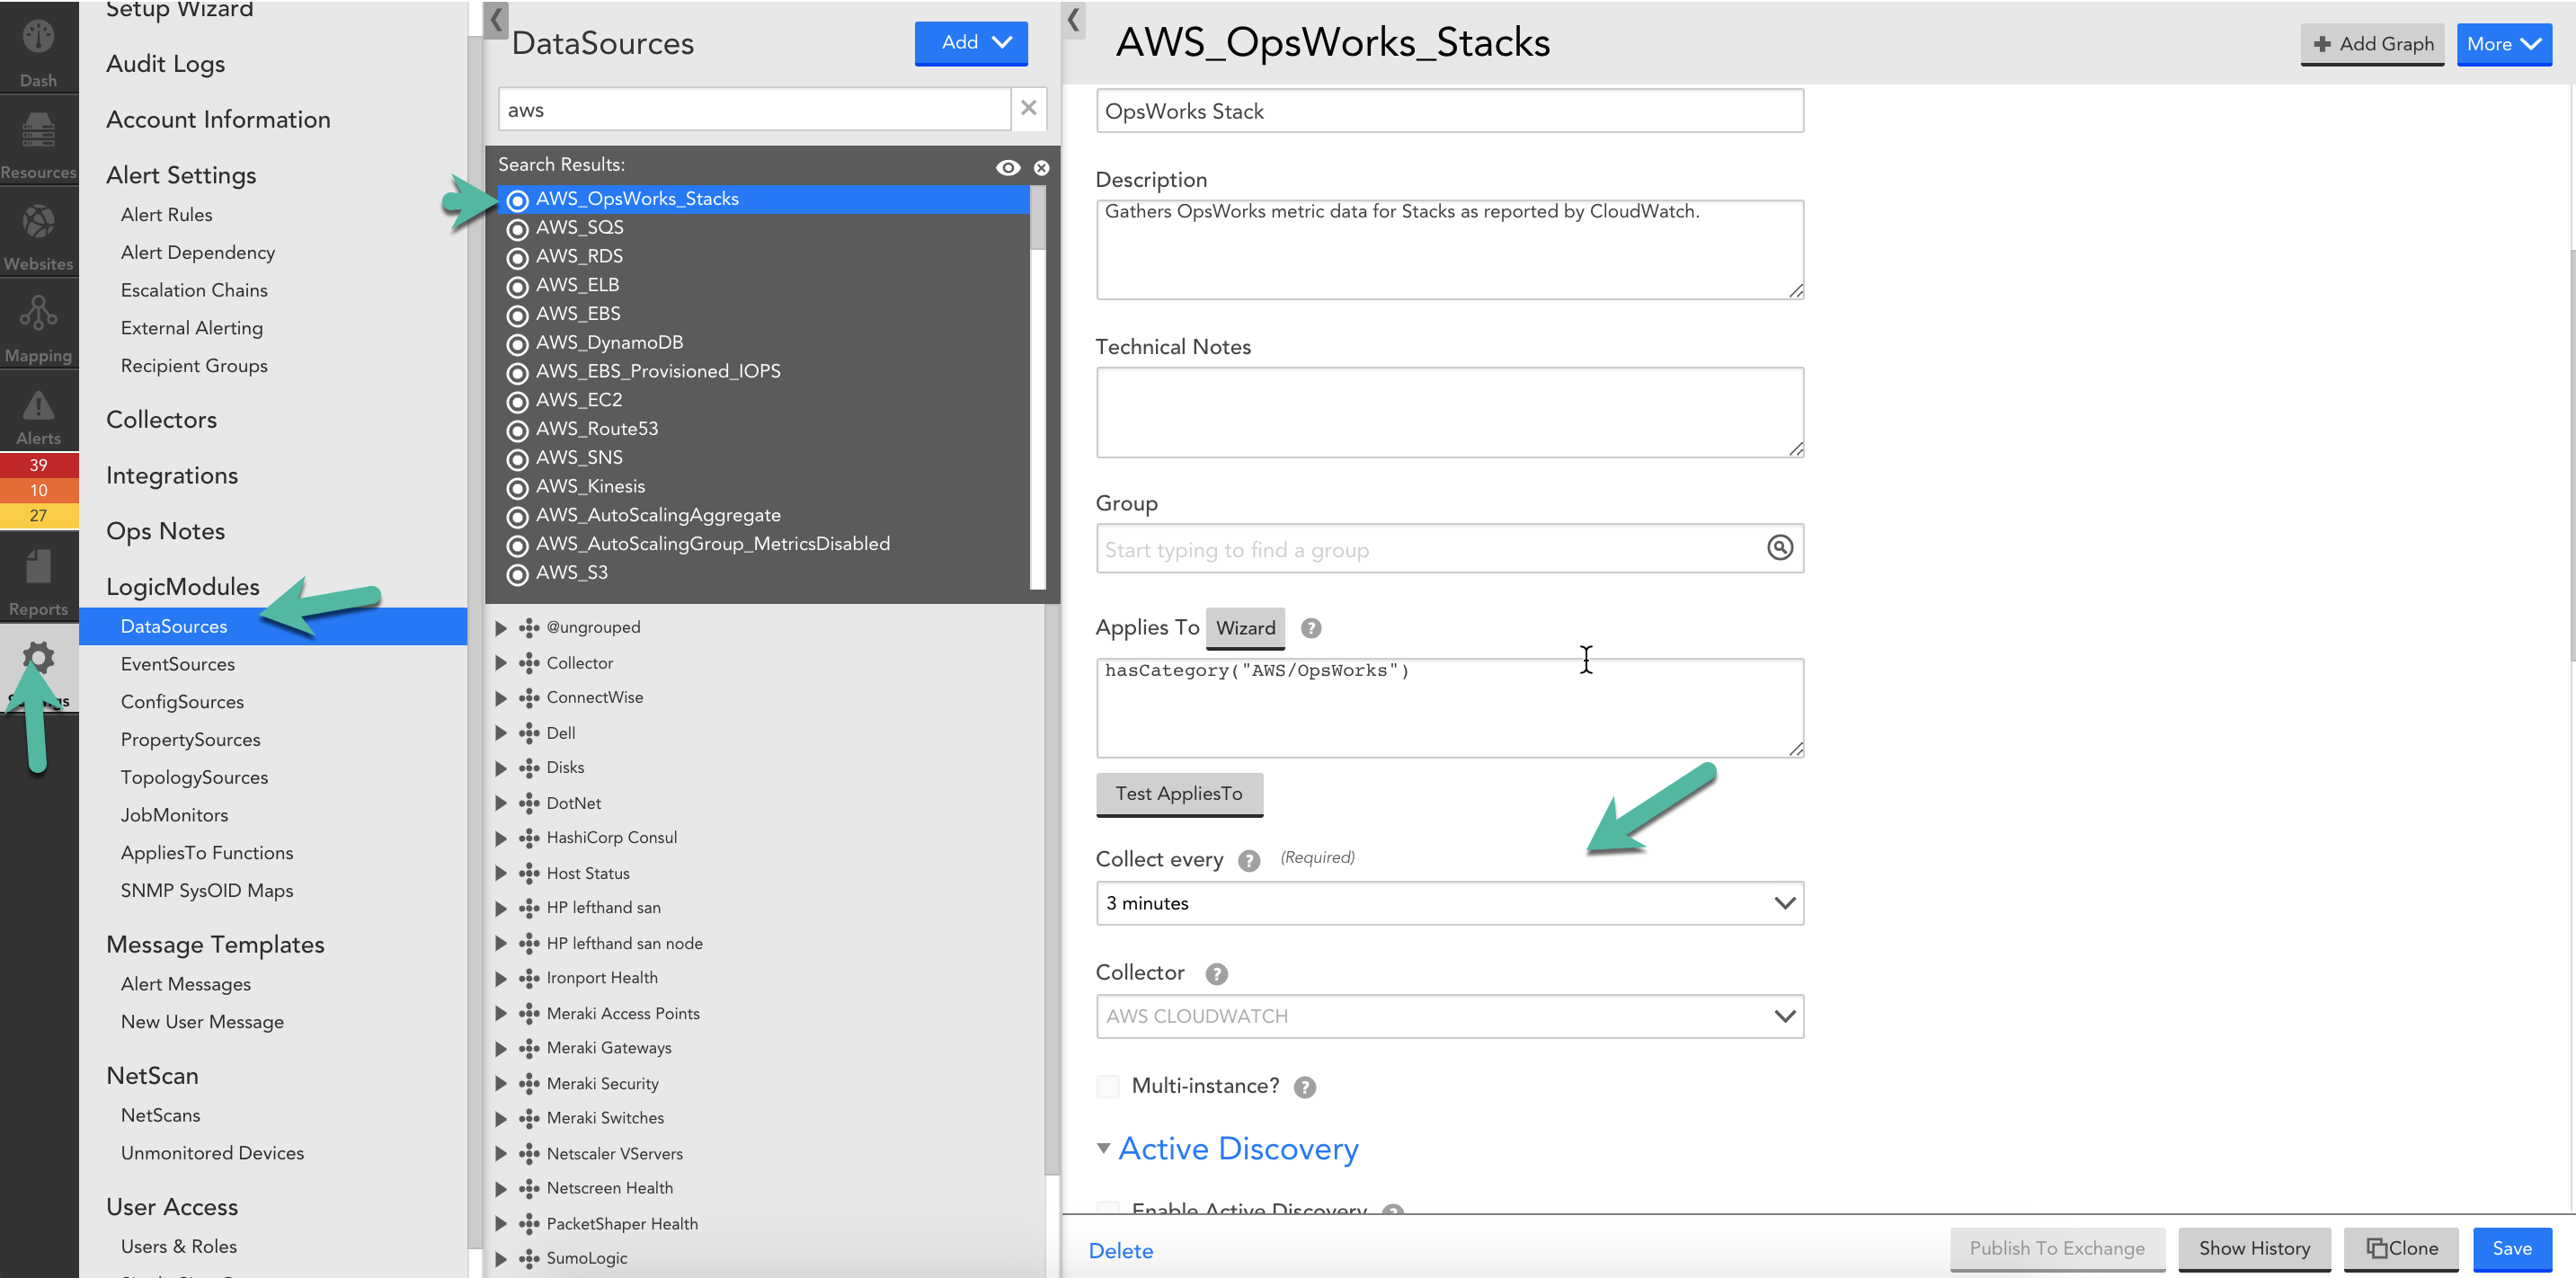
Note:- there is limit of 500 call per min https://www.logicmonitor.com/support/rest-api-developers-guide/overview/using-logicmonitors-rest-api#rate-limiting:~:text=API%20Authentication.-,Rate%20Limiting,-Rate%20limits%20are
Hope this has help you to understand and open for suggestions on my explanation.