Forum Discussion

Dominique's avatar
Dominique
Icon for Advisor rankAdvisor
2 years ago
Solved

Collectors Capacity review

Hello,

What are the best reports to be done on collectors to verify their performances?

  • CPU
  • RAM
  • Disk (I/O, Space...)
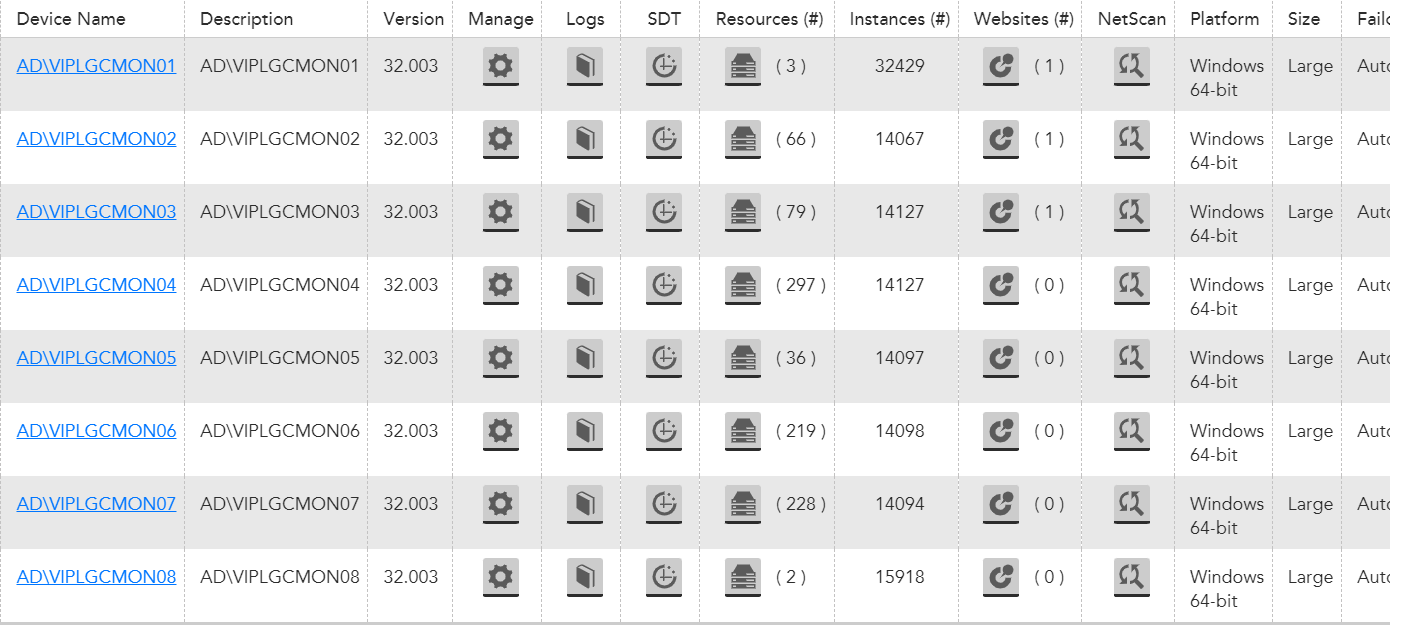
  • Resources #
  • Instances #

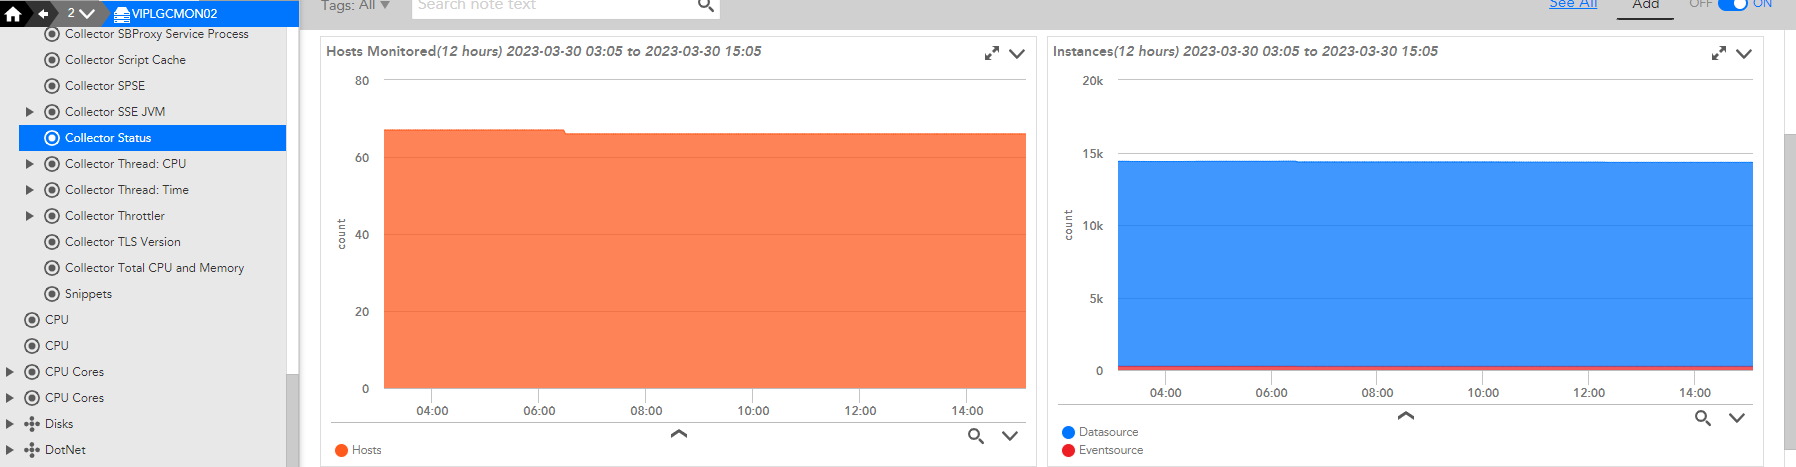
I attached below the data in the screenshots I am looking to collect in a excel file...

Thanks,

Dom

  • “Collector Thread: Time” or “Collector Thread: CPU” in your screenshot are good ones as well.

    If you see any specific instance spiking (let’s say, batchscript), it means the collector needs more threads put towards that collection method. The threads can be raised in the collector config (colector.batchscript.threadpool is a very common one to raise), but should only be done if the CPU and Memory of the host are not reaching their peak. I’d recommend reaching out to support before making any collector config changes for general guidance.

    Collector Data Collecting Tasks (also seen under that collector datasource list in your screenshot) is also very useful. If you see a queue depth (on graph), it might mean the collector is having trouble keeping up with the load.

5 Replies

  • “Collector Thread: Time” or “Collector Thread: CPU” in your screenshot are good ones as well.

    If you see any specific instance spiking (let’s say, batchscript), it means the collector needs more threads put towards that collection method. The threads can be raised in the collector config (colector.batchscript.threadpool is a very common one to raise), but should only be done if the CPU and Memory of the host are not reaching their peak. I’d recommend reaching out to support before making any collector config changes for general guidance.

    Collector Data Collecting Tasks (also seen under that collector datasource list in your screenshot) is also very useful. If you see a queue depth (on graph), it might mean the collector is having trouble keeping up with the load.

  • Hello,

    Is it possible to have these information in a report instead of dashboards…?

    Thanks,

    Dom

  • Yes, you should leverage the resource metrics trends report.

    Report creation: https://www.logicmonitor.com/support/reports/creating-managing-reports/what-are-reports

    Resource metric trends report info: https://www.logicmonitor.com/support/reports/report-types/device-metric-trends-report

    Use the same datasources you want to pull from in the report. If you have your collectors dynamically grouped, (maybe already in “Devices by Type/Collectors”), you can target that group.