Forum Discussion

Jordan-Eil's avatar
Jordan-Eil
Icon for Neophyte rankNeophyte
2 years ago

Is anyone else getting issues creating Bandwidth Reports on Switches?

Currently attempting to generate a Bandwidth Report with more than 10 interfaces causes an error, where previously it would just create a report and provide the “Top 10” interfaces.

I am curious if anyone else is having the trouble. 

Also, Netflow reports generate the same error, logs indicate an inability to create more than 20 graphs. This error is odd, as just a few days ago we had a report run with over 30 graphs without issue.

Curious if anyone else has run into this issue.

  • I just ran it on all interfaces of the switch (28 instances) and it ran successfully as well. 

    Hope that helps steer you the right way for support! 😀
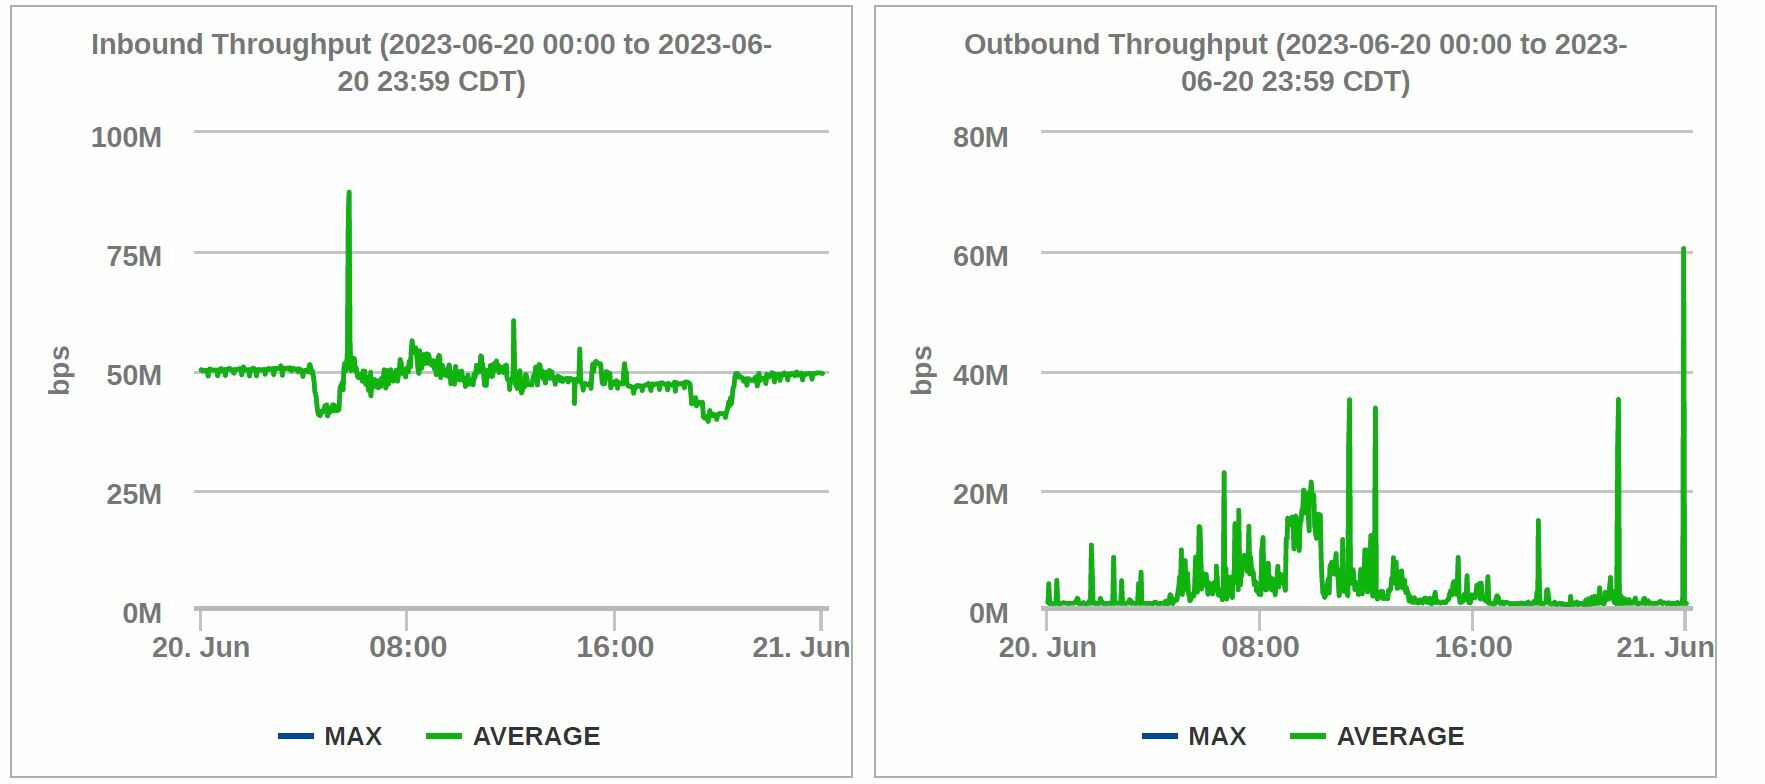
  • I just ran it on all interfaces of the switch (28 instances) and it ran successfully as well. 

    Hope that helps steer you the right way for support! 😀
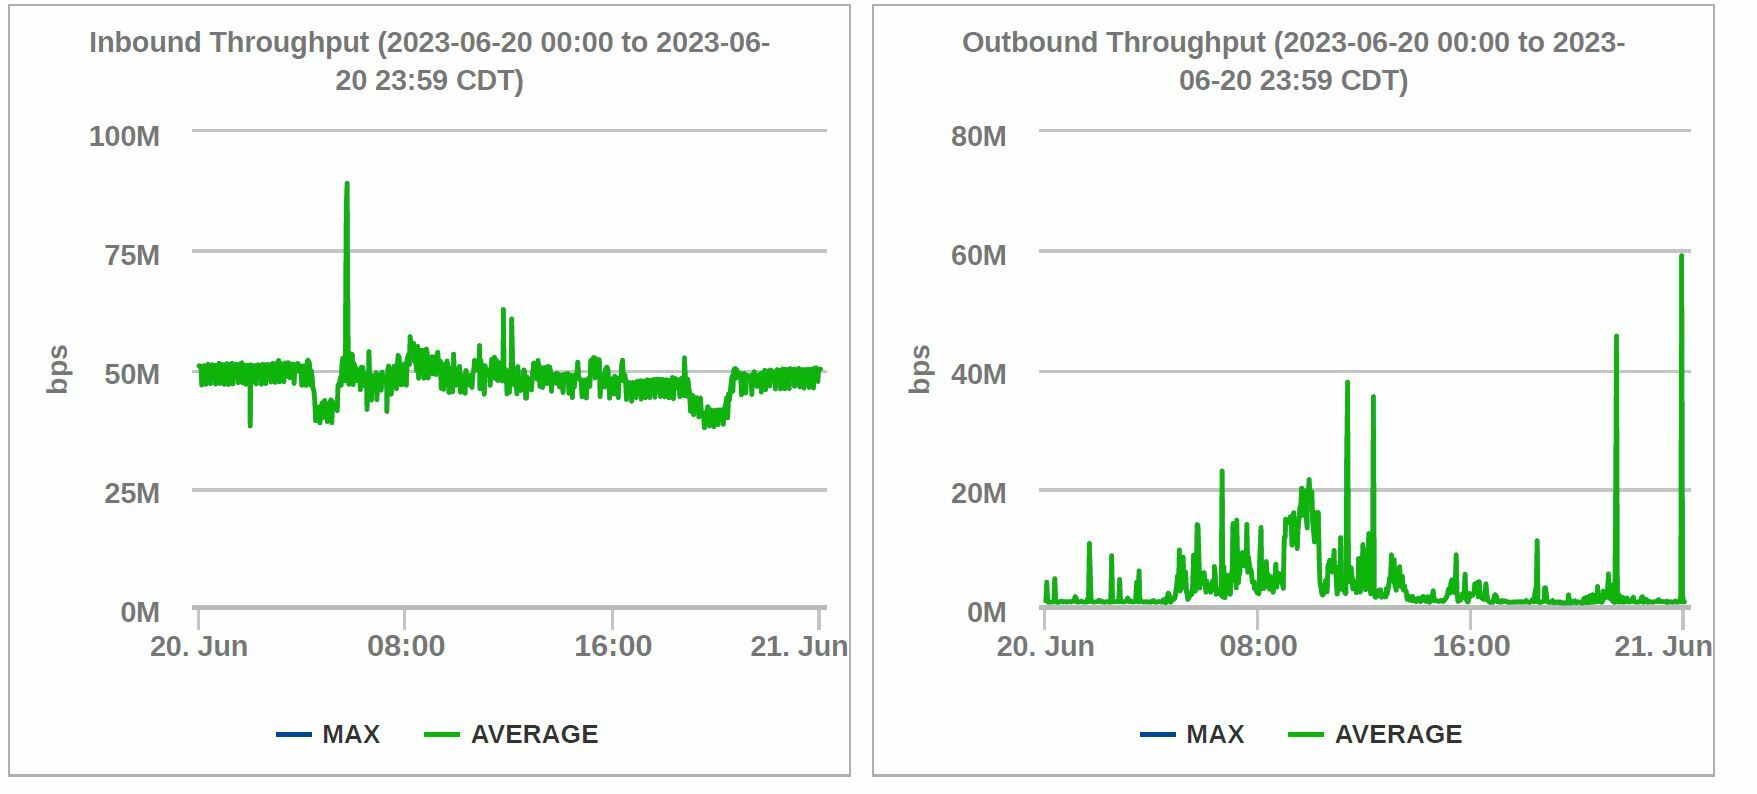
    I hope so too, thanks.  

  • I just ran it on all interfaces of the switch (28 instances) and it ran successfully as well. 

    Hope that helps steer you the right way for support! 😀

  • Thanks! I was able to run the report successfully with graphs for Top 10 interfaces on one of our core switches. 

    How do you get more than 10 interfaces with the “Top 10 Only: Selected”?


    Without it selected we get too much - with it selected we normally get what you got here, a normal output.

    Currently, we are not.  I guess we’ll have to follow-up with support and see what’s going on.

    Out of curiosity, how many interfaces are on your core switch that LM has instances for?

  • Thanks! I was able to run the report successfully with graphs for Top 10 interfaces on one of our core switches. 

    How do you get more than 10 interfaces with the “Top 10 Only: Selected”?


  • Oh Sorry about that. Could you send a sample of how you have the report setup? I can mirror it and give it a shot.

    Currently set as such:

    Report Type: Bandwidth

    Format: PDF

    Report Access: High Flexibility

    Time Range: Last Calendar Day

    Resources: *Switch to analyze* 

    Datasource: Network Interfaces (SNMP_Network_Interfaces )

    Instance: *

    Description: *

    Top 10 Only: Selected

    Scale by Units of 1024: Selected

    Report Format: Graph per Interface

    FYI: this works if there are 10 or less interfaces, more than 10 causes the error.

  • Oh Sorry about that. Could you send a sample of how you have the report setup? I can mirror it and give it a shot.

  • Hi @Jordan-Eil

    I just ran this report in our environment and used a device group that had about 8 switches and it pulled every single interface for all switches in the group and reported it in the csv export. 

    Sorry not sure why you’re getting that error because I haven’t experienced it but I at least verified this is most likely not a wide spread issue with LM/Envision.

    CSV reports work fine, it’s when we attempt to display a graph - using either .html or .pdf - CSV isn’t a problem but also isn’t helpful to outside agents.

  • Hi @Jordan-Eil

    I just ran this report in our environment and used a device group that had about 8 switches and it pulled every single interface for all switches in the group and reported it in the csv export. 

    Sorry not sure why you’re getting that error because I haven’t experienced it but I at least verified this is most likely not a wide spread issue with LM/Envision.