Jordan-Eil Neophyte
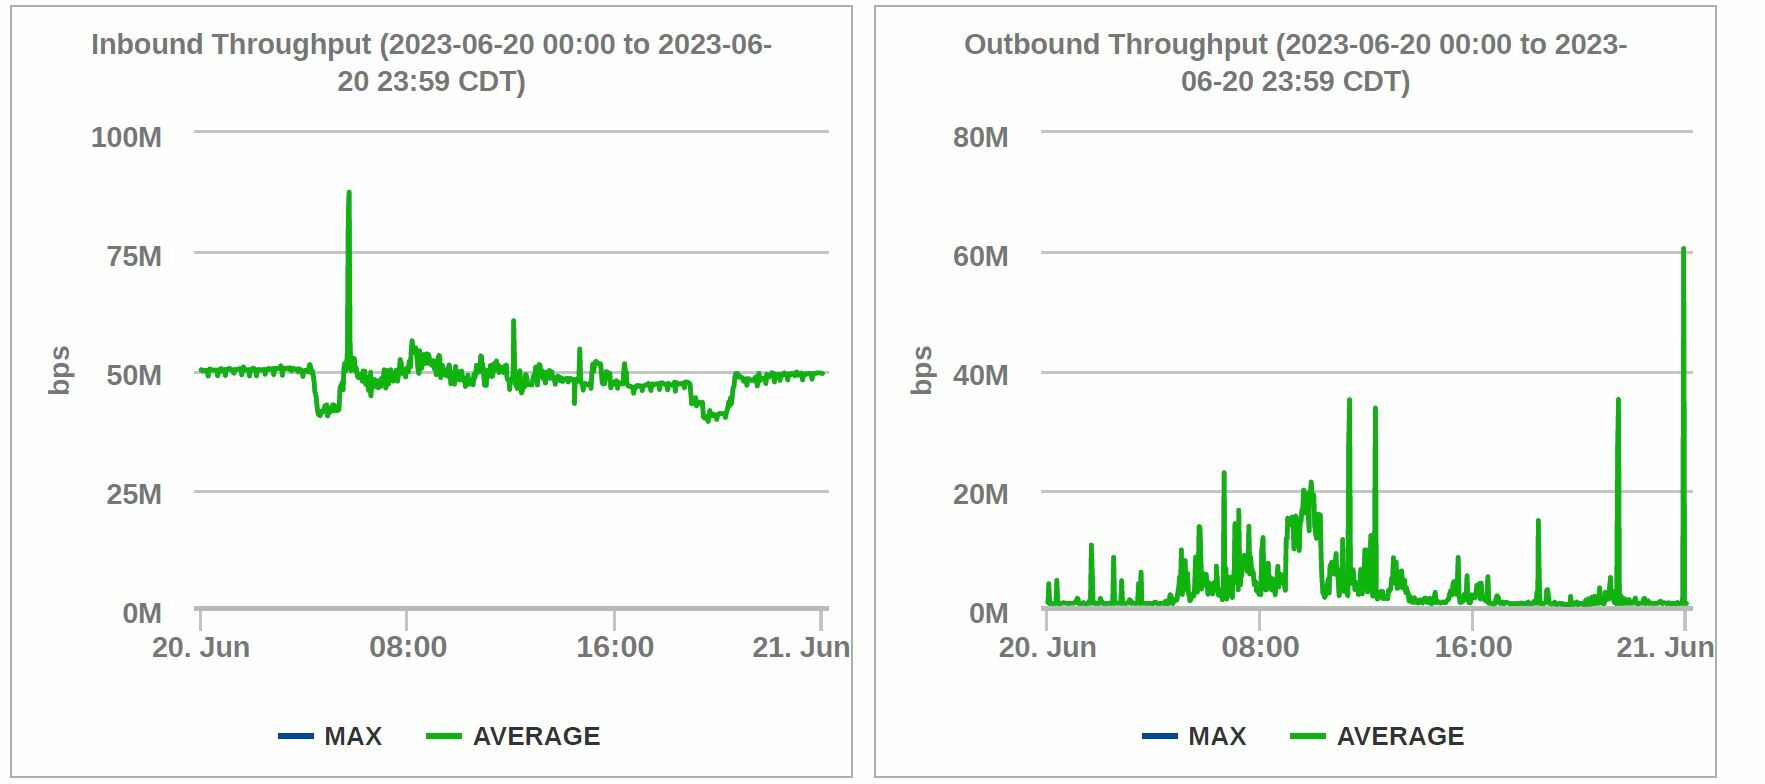
2 years agoNeophyteIs anyone else getting issues creating Bandwidth Reports on Switches?
Currently attempting to generate a Bandwidth Report with more than 10 interfaces causes an error, where previously it would just create a report and provide the “Top 10” interfaces.
I am curious if anyone else is having the trouble.
Also, Netflow reports generate the same error, logs indicate an inability to create more than 20 graphs. This error is odd, as just a few days ago we had a report run with over 30 graphs without issue.
Curious if anyone else has run into this issue.
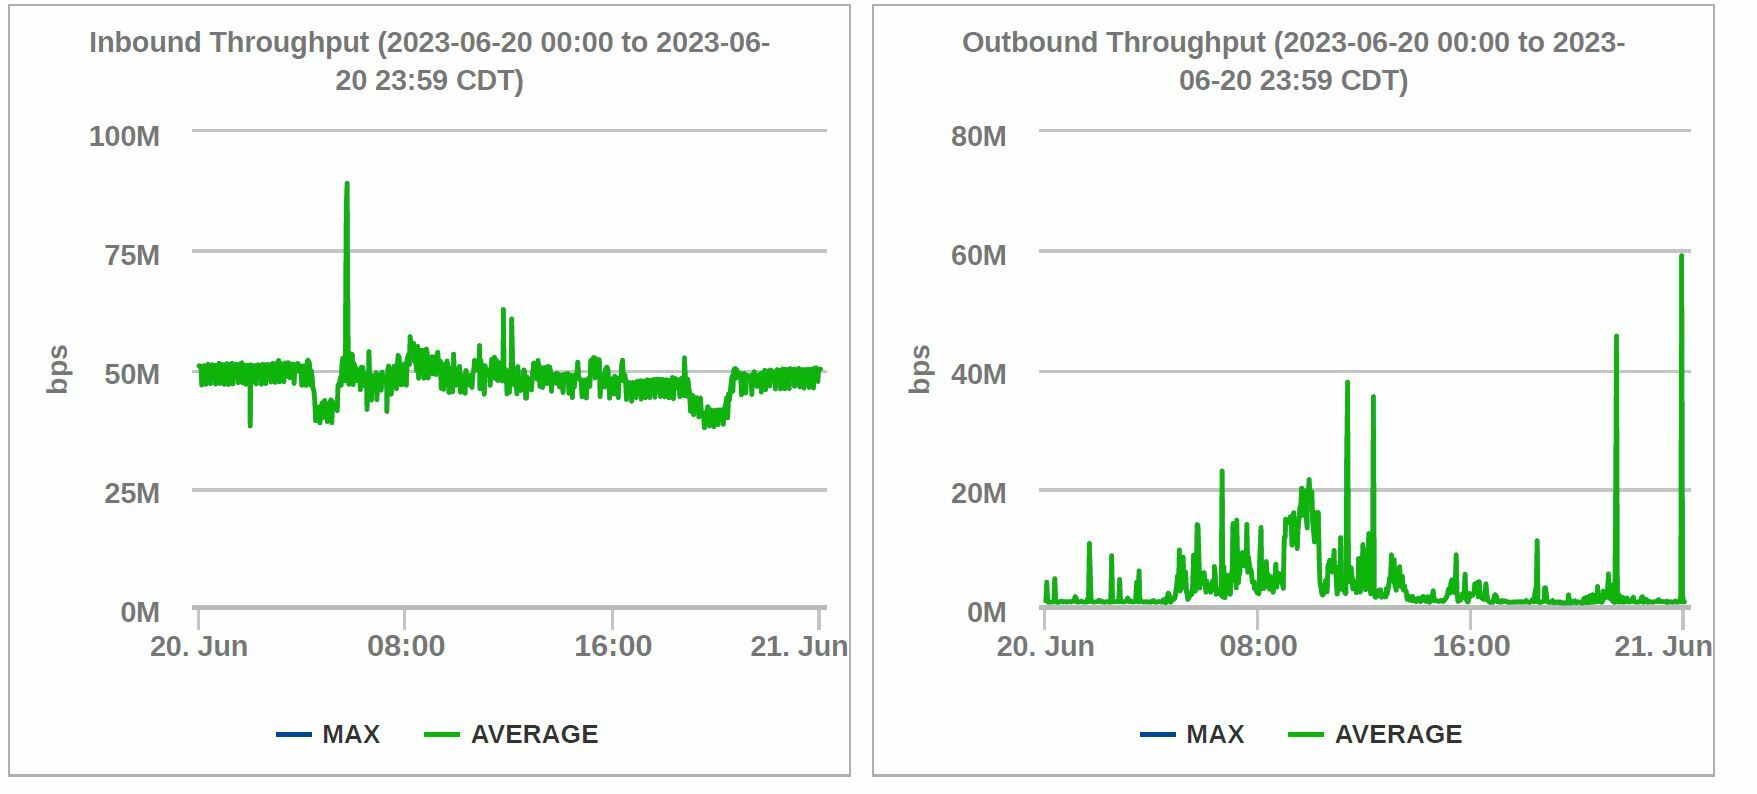
I just ran it on all interfaces of the switch (28 instances) and it ran successfully as well.
Hope that helps steer you the right way for support! 😀