AustinC Neophyte
NeophyteNeophyteDo there presently exist any methods for generating advance resource metric trends, by chance? I'm thinking something along the lines of '95/99th' percentiles and the likes, in the form of a report. If not, what's the next best thing?
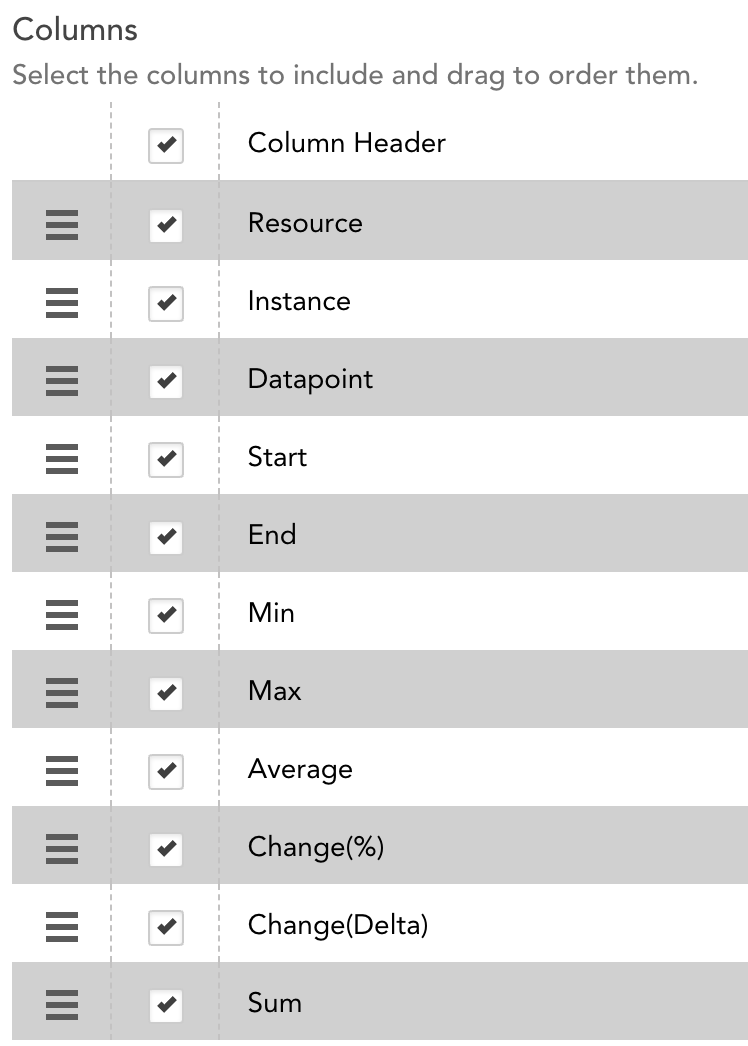
The resource metric trend will give you min/max/average/change%/change(delta)/and sum.
You can add virtual datapoints to trend graphs on dashboards using the percentile infix functions. They only work as virtual datapoints and not complex datapoints because complex datapoints only take into consideration the data from the current poll. Virtual datapoints use the time bounds of the graph to calculate the percentile numbers. You can take any dashboard built with this kind of trend graph and make it into a "report" by scheduling it.
Neophyte
On 8/25/2021 at 11:41 AM, Stuart Weenig said:The resource metric trend will give you min/max/average/change%/change(delta)/and sum.
You can add virtual datapoints to trend graphs on dashboards using the percentile infix functions. They only work as virtual datapoints and not complex datapoints because complex datapoints only take into consideration the data from the current poll. Virtual datapoints use the time bounds of the graph to calculate the percentile numbers. You can take any dashboard built with this kind of trend graph and make it into a "report" by scheduling it.
Am I right in assuming that this will only allow users to see a _visualization_ of these percentiles? This pretty strongly defeats the purpose of the use case for percentiles, which are most commonly needed for _text_ based reporting.
The resource metric trend report will give you min/max/average/change%/change(delta)/sum. That is a tabular, text based output. The other option would give you a visual within a dashboard.
NeophyteOn 8/30/2021 at 10:07 AM, Stuart Weenig said:The resource metric trend report will give you min/max/average/change%/change(delta)/sum. That is a tabular, text based output. The other option would give you a visual within a dashboard.
Got it - That matches my understanding. Appreciate it. I'll key a feature request for having percentile calculations available in a report - luckily, I just found out that this _isn't_ a requirement for my current solution, so I'lll be happy with just the visualization at this point :)/emoticons/smile@2x.png 2x" title=":)" width="20" />
It is in the report.
Neophyte1 hour ago, Stuart Weenig said:It is in the report.
Sorry, I don't follow - I do not see '95th percentiles' being present in the resource metric reports?
You're right, the 95th percentile isn't there. But for other aggregation methods: create a "Resource Metric Trend Report". At the bottom of the settings are options for aggregate functions. You can always generate the report in CSV then calculate any percentile you need.
Neophyte16 minutes ago, Stuart Weenig said:You're right, the 95th percentile isn't there. But for other aggregation methods: create a "Resource Metric Trend Report". At the bottom of the settings are options for aggregate functions. You can always generate the report in CSV then calculate any percentile you need.
Hrm... It sees to me that the only way I could calculate percentiles is if I ran multiple reports for the time frame I want (i.e. day to day, for 7 days), and then calculated 95th percentile from that? Unless there is some other fancy math that I'm missing that can be applied to the 'in/max/average/change' values...?
Yeah, or do it on the graph with a virtual datapoint calculating the 95th percentile.