Employee
Device and Alert counts per group
I actually wrote a first version of this back in 2016 but for whatever reason didn't post it here, so, you may be amongst the 30+ customers using older versions of these modules.
However, these, at v3, now use LM API v3 (no major change from v2), have additional diagnostic datapoints in the event of code failure, more intelligent alerting on failure, slightly revised graphs, and a substantially cleaner set of code. And, I figured it was time to write this up.
I've kept any prior datapoint names unchanged, along with the actual DS names, so import *shouldn't* cause any issues with historical data, dashboards, alert rules, etc etc etc, but as ever it's possible I missed something so please exercise the usual cautions when importing any updated DataSource. The DS Display Names have changed, to "LogicMonitor ..." to align with our core portal metrics DataSources, and the AppliesTo now also aligns with those core modules (previously, in Exchange, these modules were saved with AppliesTo of false(), for you to determine application after import).
What:
API-calling DataSources to (as the names suggest) allow you to track device and alert counts for any resource groups you so choose within your LogicMonitor platform.
Why:
This finds particular application for MSPs wanting to track platform usage and alert load per end customer, for example to ensure said customers are being billed appropriately. However, they are also in use with large enterprise customers, to track LM consumption per region, business unit, function team, etc.
You will need:
LogicMonitor API credentials set as Resource Properties for whichever Resource(s) you apply either or both module to (by default, your '<accountName>.logicmonitor.com' portal resource, if you've set one up). These modules accept the same properties as our core LogicMonitor_Portal_xxx modules and will accept lmaccess.id, logicmonitor.access.id, apiaccessid.key for the API token ID; and lmaccess.key, logicmonitor.access.key, or apiaccesskey.key for the token key (in those orders of preference).
The script will take the account name directly from collector settings.
Then what?
Whether you use the Active Discovery or Manual Instances version (or indeed both) will depend on which groups you want to monitor.
Active Discovery option:
If there is a programmatic way to determine groups, use the AD version. This is by far preferred as it's then "fit and forget" and will find newly-matching groups as they come in to being, and you do this by creating a new Resource Property:
deviceAndAlertCount.groupsFilter
...with a value that is a valid API filter for the /devices/groups API call.
Example:
Imagine you're an MSP with a folder structure where you have a "Customers" resource group, and per-customer groups within that, e.g.:
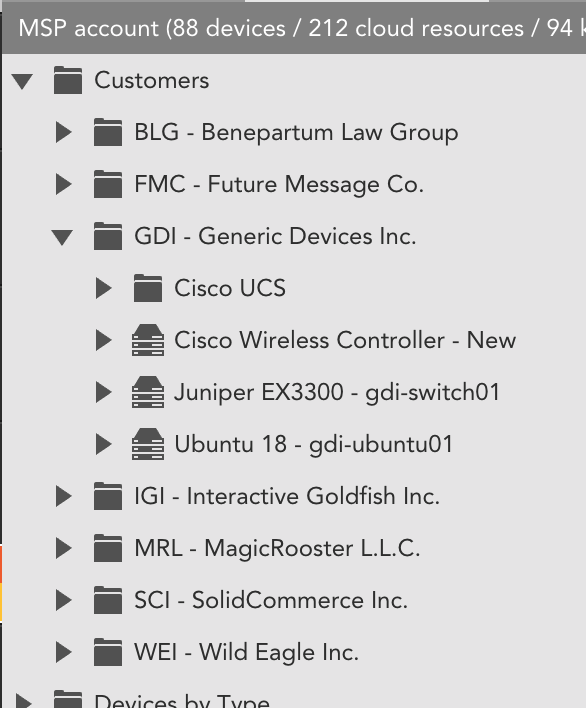
You'll likely want to monitor totals for each Customer's top level group, but you likely won't care about the specific breakdown per subgroups within a customer (e.g. you likely won't care about the count specifically within the "Cisco UCS" group under the GDI group).
In the above example, your API filter could be:
fullPath:"Customers/*",fullPath!:"*/*/*"
...i.e., all groups with a fullPath starting "Customers/" but excluding any group whose fullPath contains two or more slashes.
Or e.g.:
parentId:"[system.deviceGroupId of the Customers Group]"
You can test your proposed filters by running the AD script code in the Collector debug. If you don't set any filters, the script will fall back to only creating an instance for the root folder of your account (groupId of 1).
Any valid API filter(s) can be used within this property value, for example on fullPath, name, id, parentId, etc. See https://www.logicmonitor.com/swagger-ui-master/dist/#/Device Groups/getDeviceGroupList for expected fields.
Note that instances are persistent, to accommodate (a) people breaking the property value, and (b) e.g. customers leaving, customer folders getting accidentally deleted, etc. You can manually delete instances if necessary.
Manual Instances version:
If you really really really can't come up with a sensible programmatic way to grab the groups you want (and there may be times when this is true), the manual version allows to to set arbitrary instances.
Apply the DataSource as usual; on any applicable resource it will then appear in the list of modules you can add instances for, under the "Add Monitored Instance" option for the Resource (Manage → Add Monitored Instance):
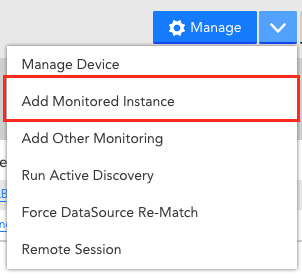
...select the DataSource from the list:
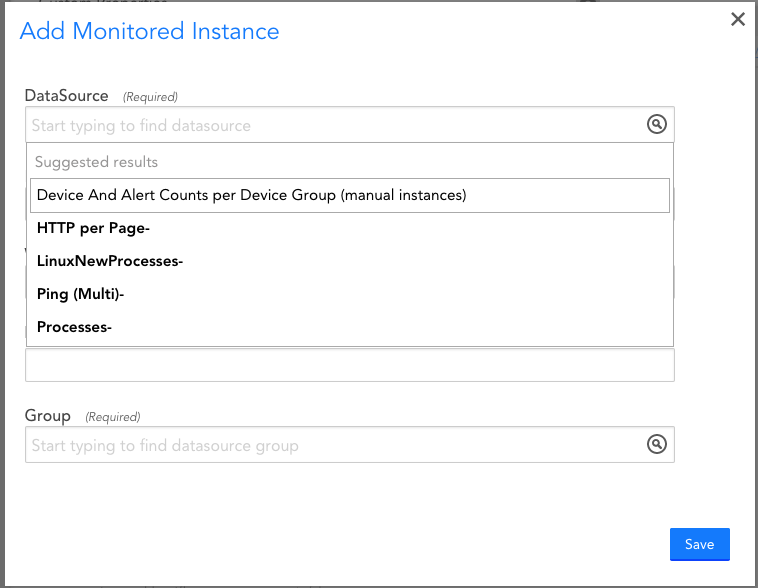
...fill in the fields and save:
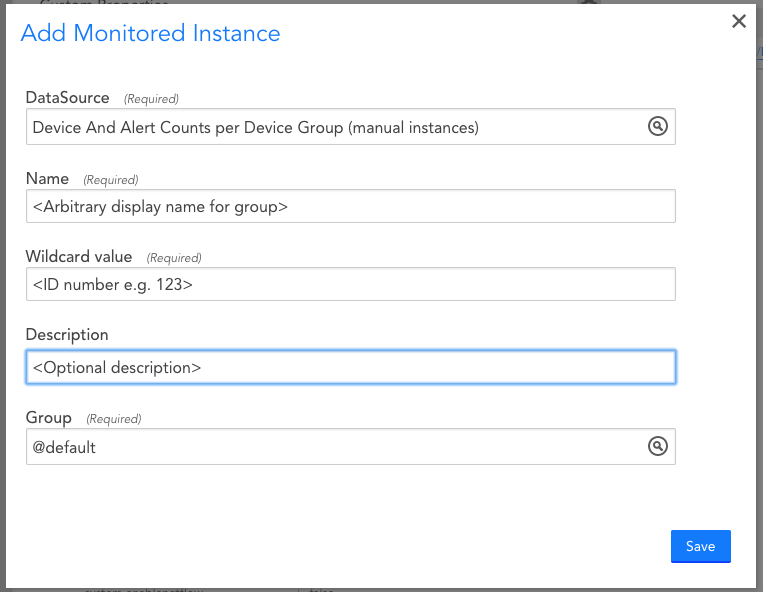
The Name field can contain pretty much whatever you like. Typically you'd add the <groupName>, or <path>/<groupName> for example, but whatever works for you is OK. This is how the instance will be seen within the device tree.
The Wildcard value must be the numeric group ID (system.deviceGroupId) of the Group to be monitored. Anything non-numeric, or a number that does not exist as a group ID, will cause an error (as you'd expect) and an absence of useful data (as you'd also imagine).
The Description is optional.
Repeat as often as you like for whatever groups you need.
Update 2022-10-24: Version 3.1 includes Kubernetes counts, as these are now returned in the API response.
Update 2023-07-07: Version 3.2 corrects a collection script error that was causing the double-counting of alerts that were both ACKed *and* SDTed, which in turn led to an under-counting of outstanding alerts.
Update 2023-11-15: Version 3.3 corrects a bug in the rate limit retry routine, which almost no-one will ever have hit.
LM Exchange Locators:
Active Discovery version, v3.3: MK2CCH
Manual Instances version, v3.3: X946LX