Forum Discussion

derek_haneman's avatar
2 years ago

Convert SMTP uptime to days?

Hey all, messing around with a quick uptime dashboard for a product team. They have a bunch of Linux servers that I can pull SNMP Uptime but it needs to be converted from the whacky format to days. I’m just using the table widget on the dashboard, is there anyway to do that conversation? 

It would be nice if i could just pull the value in from the top level Resource page for the device where it already shows your uptime. Wish you could just hijack that underlying code. 
 

PS...cant edit the typo in the title. Thats lame. 

  • Amr's avatar
    Amr
    Icon for LM Champion rankLM Champion

    The SNMP_Host_Uptime datasource has Uptime datapoint that displays uptime in seconds. 

    You can check ‘perform an expression on datapoint’ in the table widget column settings to convert the value from seconds to days by dividing the uptime in seconds by 86400, this would display the Uptime value in days in the table widget.
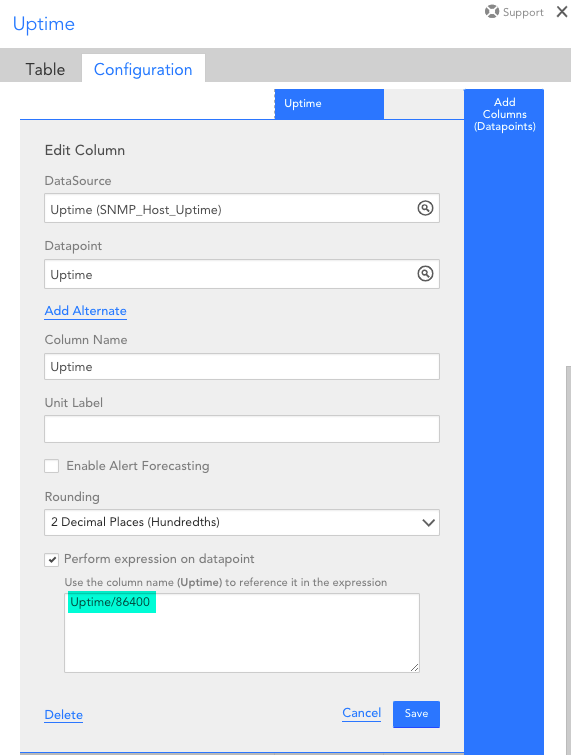
    https://www.logicmonitor.com/support/dashboards-and-widgets/widgets/table-widget#:~:text=2%20Decimal%20places.-,Perform%20expression%20on%20datapoint,-Embed%20a%20groovy 

    Alternatively, you can create a complex datapoint that converts the Uptime from seconds to days using the same equation.

    https://www.logicmonitor.com/support/logicmodules/datasources/datapoints/complex-datapoints 

  • The “Host Uptime” check should already have a UptimeDays datapoint that converts the raw value to uptime into days. Unfortunately properties like auto.endpoint.uptime don’t work in tables. It only allows numbers so you are kinda stuck with something like 2.25 days instead of “2d 4h”.

    This. I really wish property sources could just be put in tables since the information is already there as a property. Having a decimal point for a datetime piece of data is awkward

  • The “Host Uptime” check should already have a UptimeDays datapoint that converts the raw value to uptime into days. Unfortunately properties like auto.endpoint.uptime don’t work in tables. It only allows numbers so you are kinda stuck with something like 2.25 days instead of “2d 4h”.

  • Anonymous's avatar
    Anonymous

    Having worked with several uptime-like datapoints recently, I think the issue could more easily be solved by giving datapoints a Unit of Measure. If the unit was known to be seconds, the graph could auto-scale when the number grows. For example, one datapoint i recently build gives the number of seconds the container has been up and running. It works really well, except when I’m dashboarding. Because the unit is seconds, the value gets pretty large pretty quickly. It would be nice if it auto scaled to hours, then days, then weeks, especially in big number widgets where there is only one number to worry about. Obviously, it’s a bit more complicated in a line graph were some would scale to minutes and others would scale to weeks, but that’s also doable. 

    Of course it’s hard. If it was easy, I wouldn’t need LM to build it.  --Me in an actual conversation with an LM PM this week.

  • Also you can look at the “Device_BasicInfo” PropertySource if you want to see the code that creates auto.endpoint.uptime.