Grafana Data Source Plugin for the LM Metrics API
Hi team,
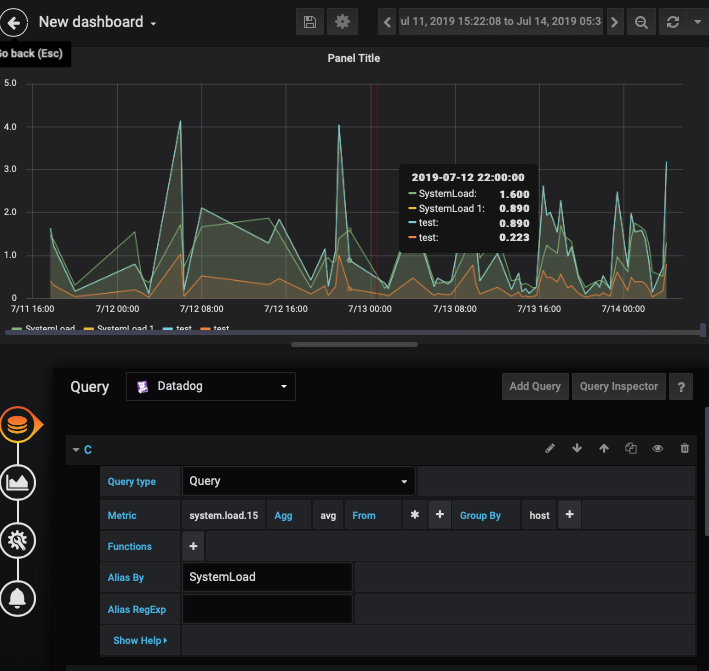
Grafana (Enterprise) has Data Source Plugins for Datadog, AppDynamics, Prometheus and other monitoring tools, but not LogicMonitor. We are trying to create a single pane of glass, but this picture will be incomplete without our multitude of metrics that we will have coming in from LogicMonitor.
Can you tell me if LogicMonitor might have an integration on the roadmap?
We want to meld our monitoring metrics into a magical single pane of glass blending infrastructure performance metrics, business metrics, cloud costs, utilization, sales, error rates, alert->incident ticket compression ratios, etc. I have it all working in real-time except for LogicMonitor, where we have to manually make API queries from our scripts, massage the metrics and then upload them to a static timeseries Graphite database. The data source plugin should call LogicMonitor metrics API directly from the dashboard.
I’ve spoken with our Grafana customer rep and they are happy to help, and possibly collaborate with you on it.
Let me know what you think,
Carl


