Forum Discussion

Archana's avatar
6 years ago

Which is the better option for consolidating data in Graph widget

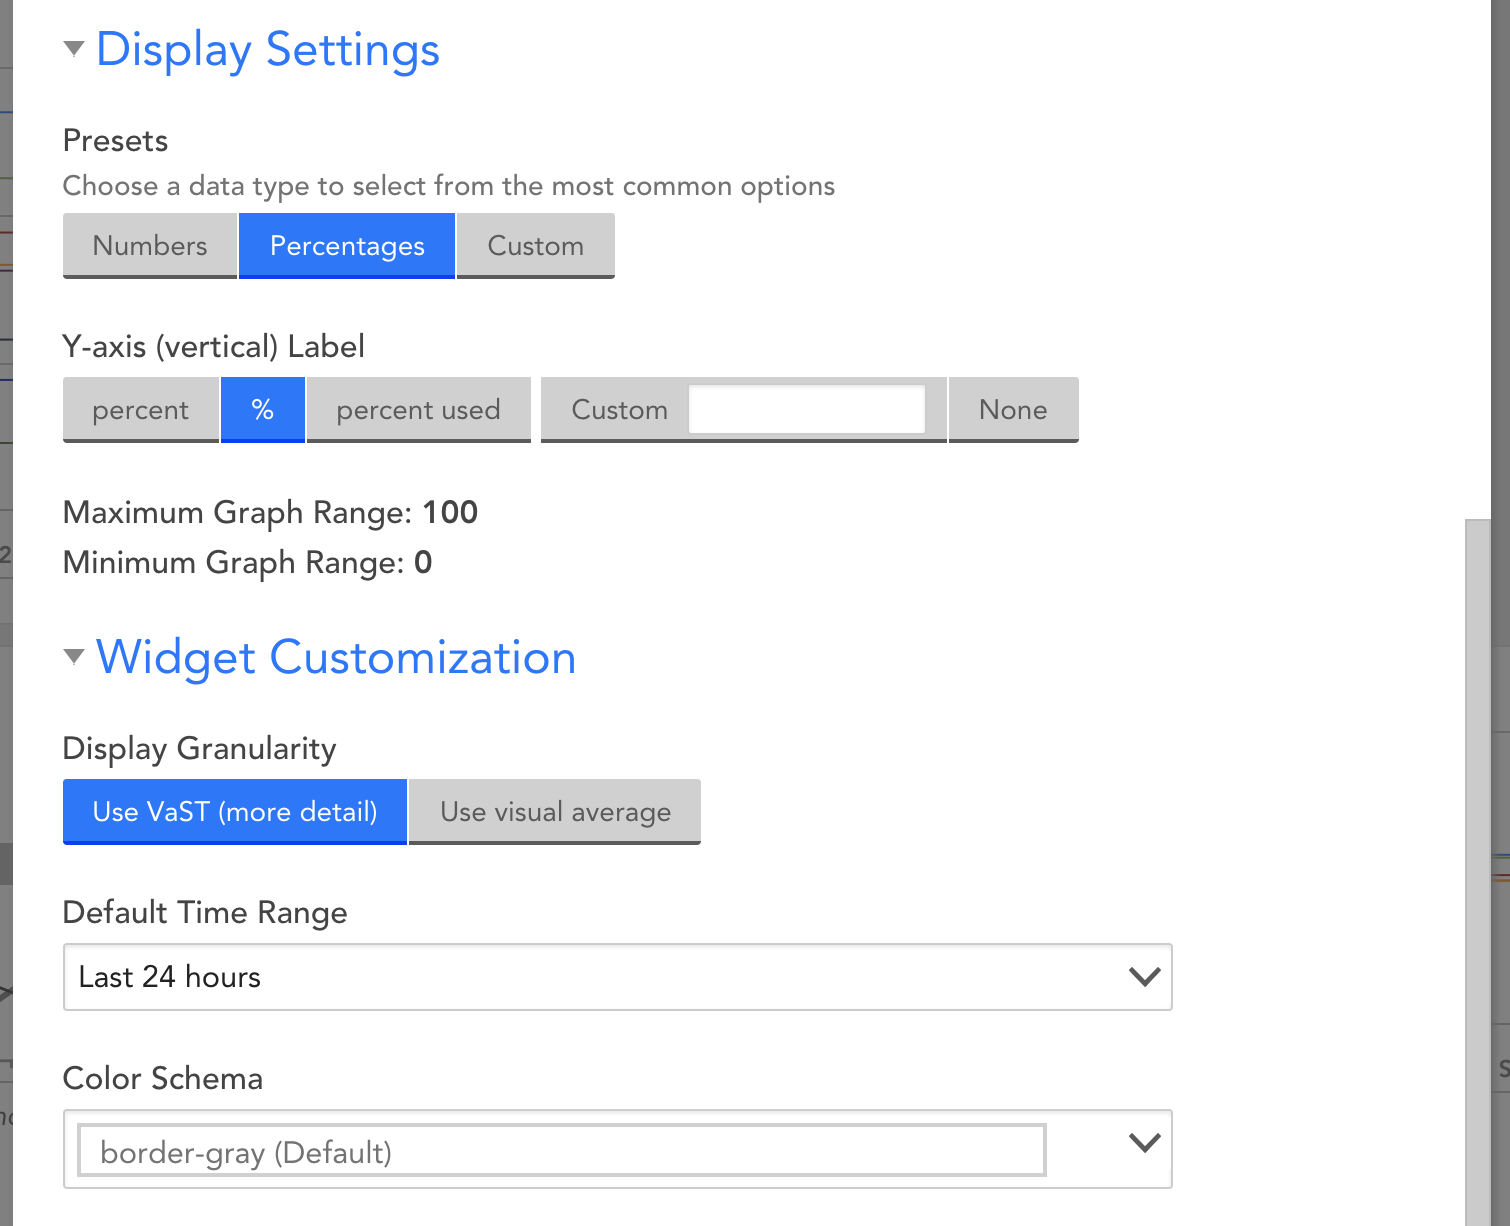
While using the Custom Graph Widget, I noticed that there are two options available under Widget customization. They are "Use VaST" and "Use Visual Average".

I have gone through the use of both the options in Logicmonitor Documents. I want to display one month trend of my CPU utilisation as it is, without any consolidation/aggregation function.

I would like to know which is the best option to choose between two to display the data values as it is in the Graph Widget. Could anyone please help me on this?

3 Replies

Replies have been turned off for this discussion
  • Hi @Michael Rodrigues,

    Thanks for your response. Here I am trying to view the data trend only for a particular month. Also data which are stored in our LogicMonitor is for once in every 2 minutes.

    So in this case what is the best option to choose to display the trend of whole month data in a graph format

  • Hi @Archana, check Visual Average for the general trend over the month. Given you're looking at CPU usage, it's probably also worth taking a look at the VaST version to see if you're getting lots of spikes. You won't see the spikes with Visual Average, but it will be harder to see the trends in VaST view.