8 years ago
SLA Widget
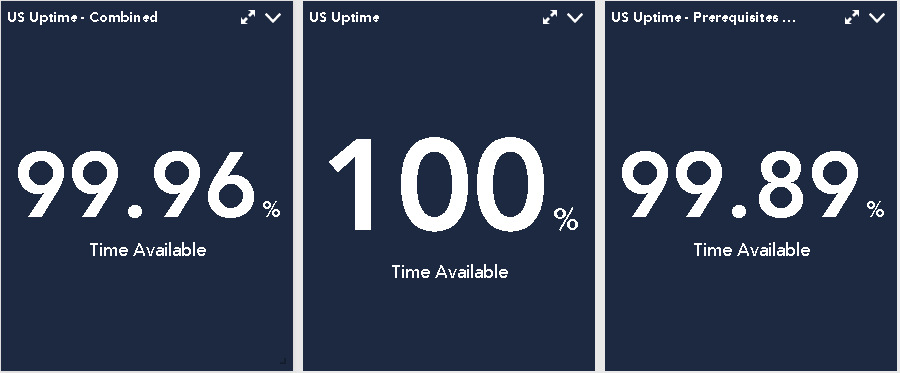
I believe that we have found a bug, right now if more than one service monitor is set under the SLA Monitor Widget the results seems to be the average.
example;
graph 1 = 100 % uptime
graph 2 = 50% uptime
Combined SLA widget(graph 1 and 2) = LogicMonitor is returning 75% where I would expect to it return the lowest uptime percentage which would be 50%.
