Monitoring Tomcat Context Web Response
Monitoring Tomcat Context with HTTP Data Collection
Tomcat is not a common home pet that people normally know. It is not a type of a cat ("a male cat") after all but an eccentric name like any other open source software's names i.e. Guacamole, Apache, RabbitMQ, etc. which I believe represents the freedom nature of those software, where creativity is the main ingredient.
I am not here to explain about Tomcat per se, either because of Google provides abundant information about it or it is out of the scope of my article. Simply put, Tomcat is a servlet whereby multiple Context containers can exist. Each context refers to a web application.
Recently we have quite a few customers request to monitor the status and response time of the Tomcat Context, which is actually simple since there are already readily available HTTP Datasource or Internal Web Service Check for that purpose. However, our customers have, in this case, multiple contexts as in normal Tomcat application.
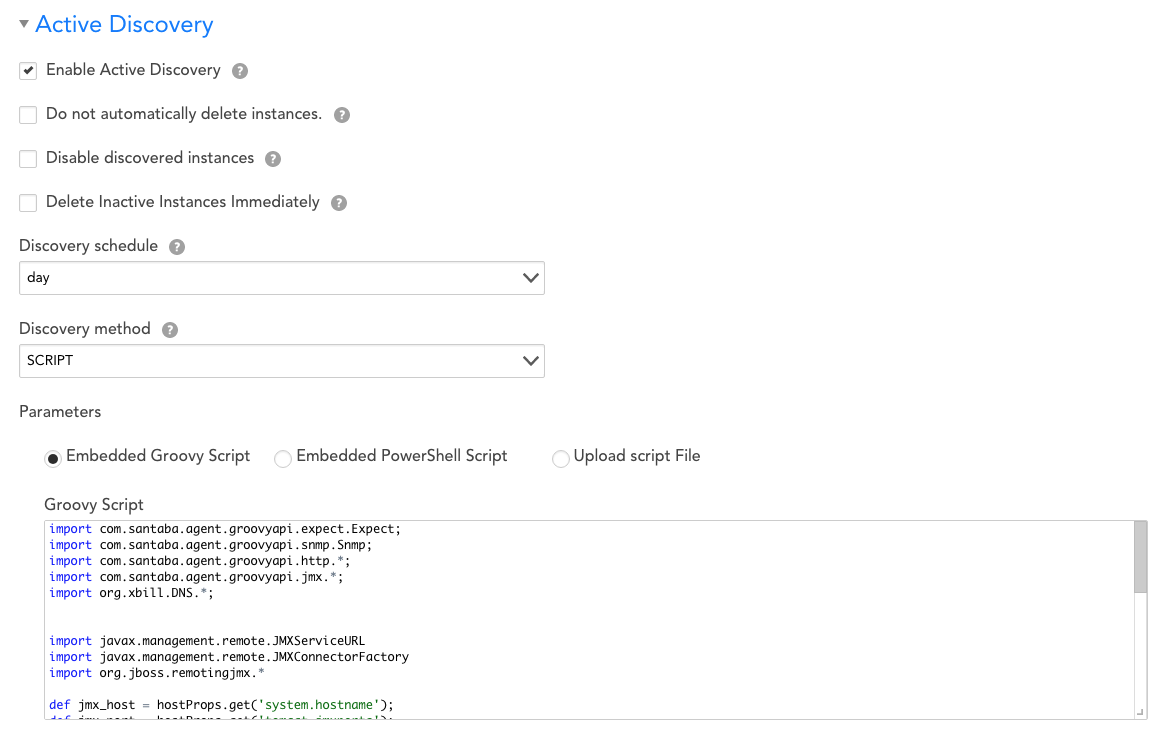
Therefore Active Discovery (AD) is needed to get the list of Contexts running on Tomcat before the simple HTTP Data collection, that has only two Datapoints (Response Time & Status) will be applied. For Active Discovery part, I would need to give credit to our renowned David Lee whom you might be familiar if you ever open a ticket with LogicMonitor Support channel.
For the sake of confidentiality, all the screenshots will be in my own lab instead of our client, it is, however, producing the similar intended result although there are more Context containers in the real production environment.
The AD is a short groovy script utilizing Java Management Extension to connect to remote Tomcat from Collector. Discovery Method chosen should be 'SCRIPT' in this Datasource.
import com.santaba.agent.groovyapi.http.*;
import com.santaba.agent.groovyapi.jmx.*;
import javax.management.remote.JMXServiceURL
import javax.management.remote.JMXConnectorFactory
import org.jboss.remotingjmx.*
def jmx_host = hostProps.get('system.hostname');
def jmx_port = hostProps.get('tomcat.jmxports');
def jmx_url = "service:jmx:rmi:///jndi/rmi://" + jmx_host + ":" + jmx_port + "/jmxrmi";
context_array = jmx_conn.getChildren("Catalina:type=Manager,host=localhost,context=*");
context_array.each
{ context ->
    println context+"##"+context
}
return 0;
(note: tomcat.jmxports is the port used by JMX to connect to Tomcat servlet and in this case is a standard port 9000)
Following is the result of AD:

(note: one of the context name is: 'context-test')
which can be tested from the collector debug window as follow:
$ !jmx port=9000 h=172.6.5.12 "Catalina:type=Manager,host=localhost,context=*"
Catalina:type=Manager,host=localhost,context=* =>
    /examples
    /manager
    /docs
    /context-test
    /host-manager
    /
As for the data collection, the mechanism that is used to collect data is 'WEBPAGE'
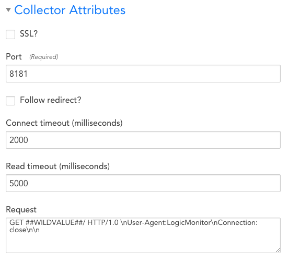
(Note: Port number will depend on the setting in Tomcat and the wildvalue will be the Context name)
Data collection can be tested in the collector with the command !http:
HTTP response received at at: 2017-04-20 09:05:30.85. Time elapsed: 3ms
HTTP/1.1 200
Accept-Ranges: bytes
ETag: W/"214-1492696731000"
Last-Modified: Thu, 20 Apr 2017 13:58:51 GMT
Content-Type: text/html
Content-Length: 214
Date: Thu, 20 Apr 2017 14:05:30 GMT
<html>
<body>
<h3>TEST Tomcat Context web access</h3>
<pre>
<>
[
    {
        status: "OK",
        context: "context-test"
    },
    {
        company:"LogicMonitor",
    }
]
</>
</pre>
</body>
</html>
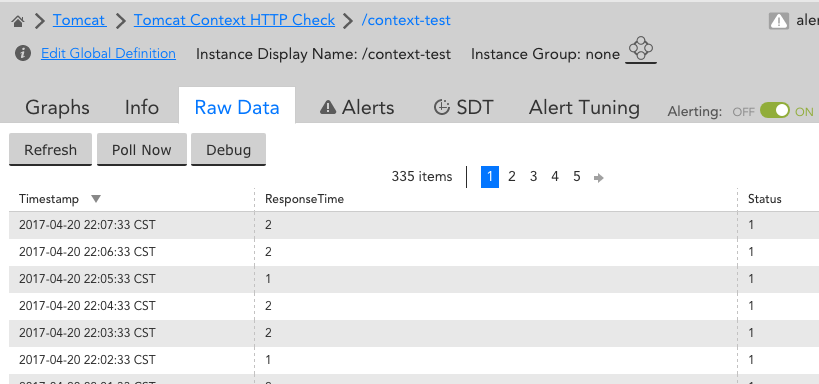
Here is the final result of the monitoring:
From the browser, the Tomcat context can be accessed just like a normal website:

The Datasource is only available for download from LM Exchange (version 1.1). This is not available in core repository of LogicMonitor Datasource.
Note:
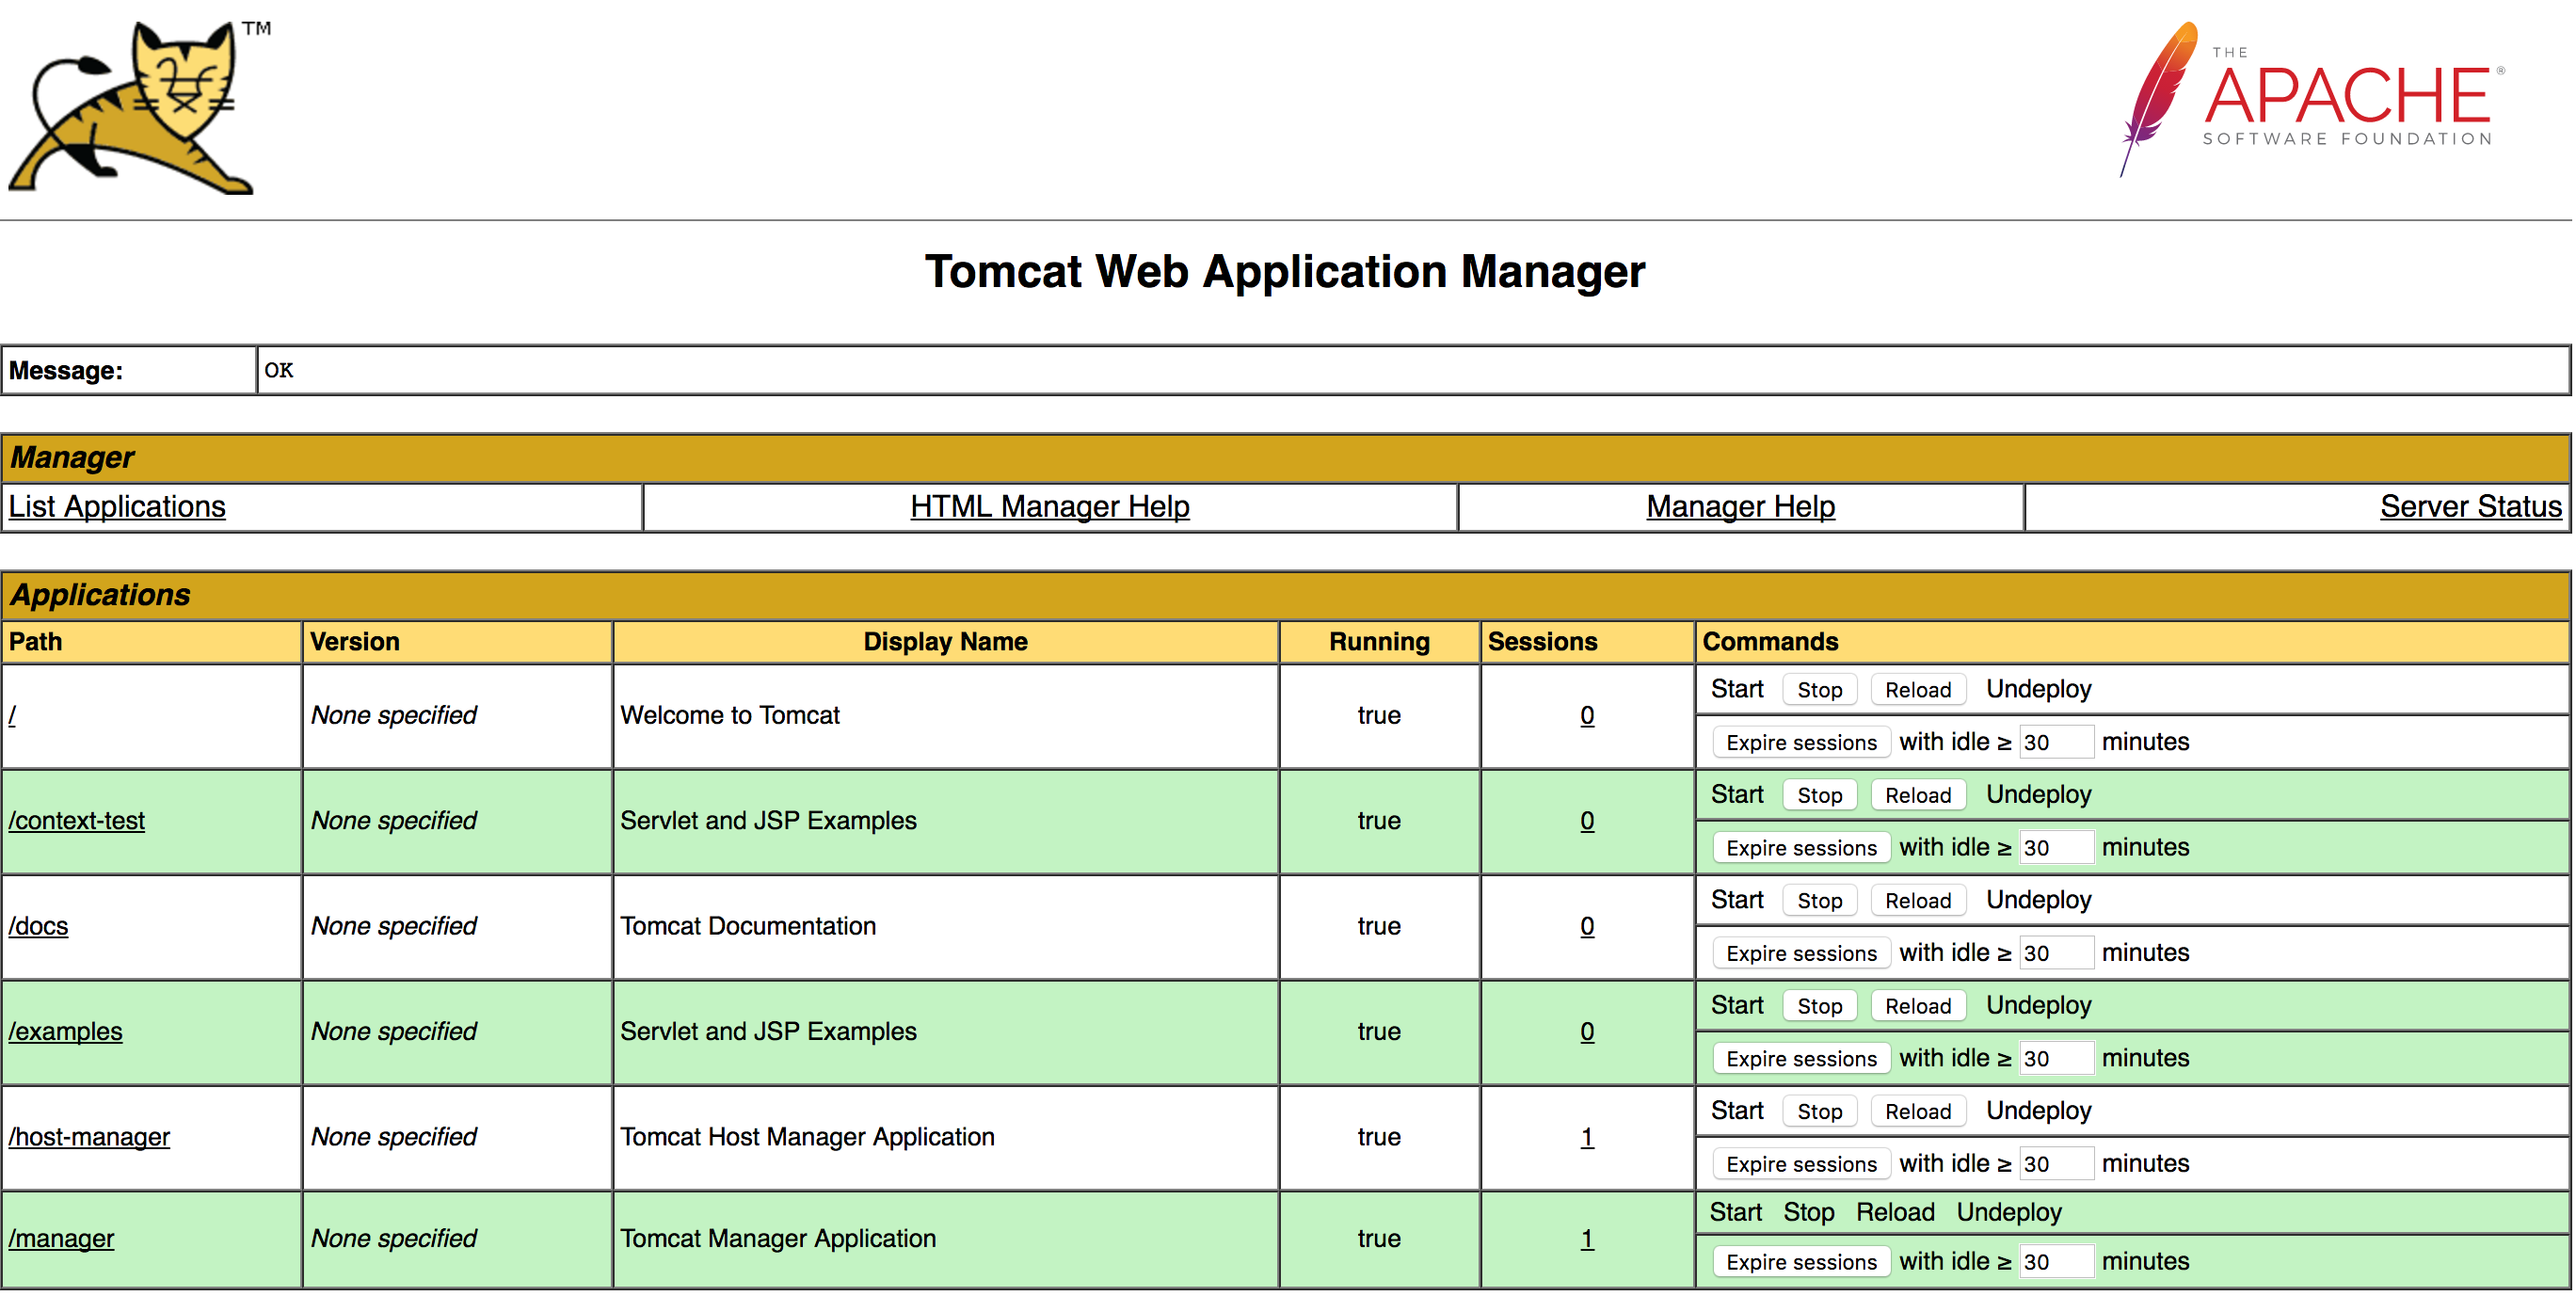
This is what Tomcat Manager looks like: