Forum Discussion

Antony_Hawkins's avatar
8 years ago

Minimal Monitoring alerter

This is the most ridiculously simple datasource, possibly ever.

Where devices end up in the 'Minimal Monitoring' dynamic group (i.e. the collector has not been able to find the device properties) the only way you know is by choosing to look in that group.

NOTE: The 'Minimal Monitoring' dynamic group does not exist in all accounts. It's a problem-catching group that we only invented a year or so back, and like any group it can be deleted. You may also have created your own 'Minimal Monitoring' group for other purposes, so check in your account FIRST, before importing this datasource.

The 'Minimal Monitoring' dynamic group this datasource is intended for has a dynamic group custom query of:

system.sysinfo == "" && system.sysoid == "" && isDevice() && !(system.virtualization) && (monitoring != "basic")

This datasource then has the very simple AppliesTo of:

join(system.groups,",") =~ "Minimal Monitoring"

The datasource is a datapump type that both returns and alerts on a value of 1 for all devices, set to alert on the second 10-minute poll, so you get a warning alert from every device within Minimal Monitoring. The poll interval and alert trigger delay combine to give a modest grace period to permit new devices to have AD run against them, to avoid false alerts.

Once changes are made such that the device properties are found, the devices will be removed from the Minimal Monitoring group and the datasource will therefore de-associate, removing the alert.

FXK3HP
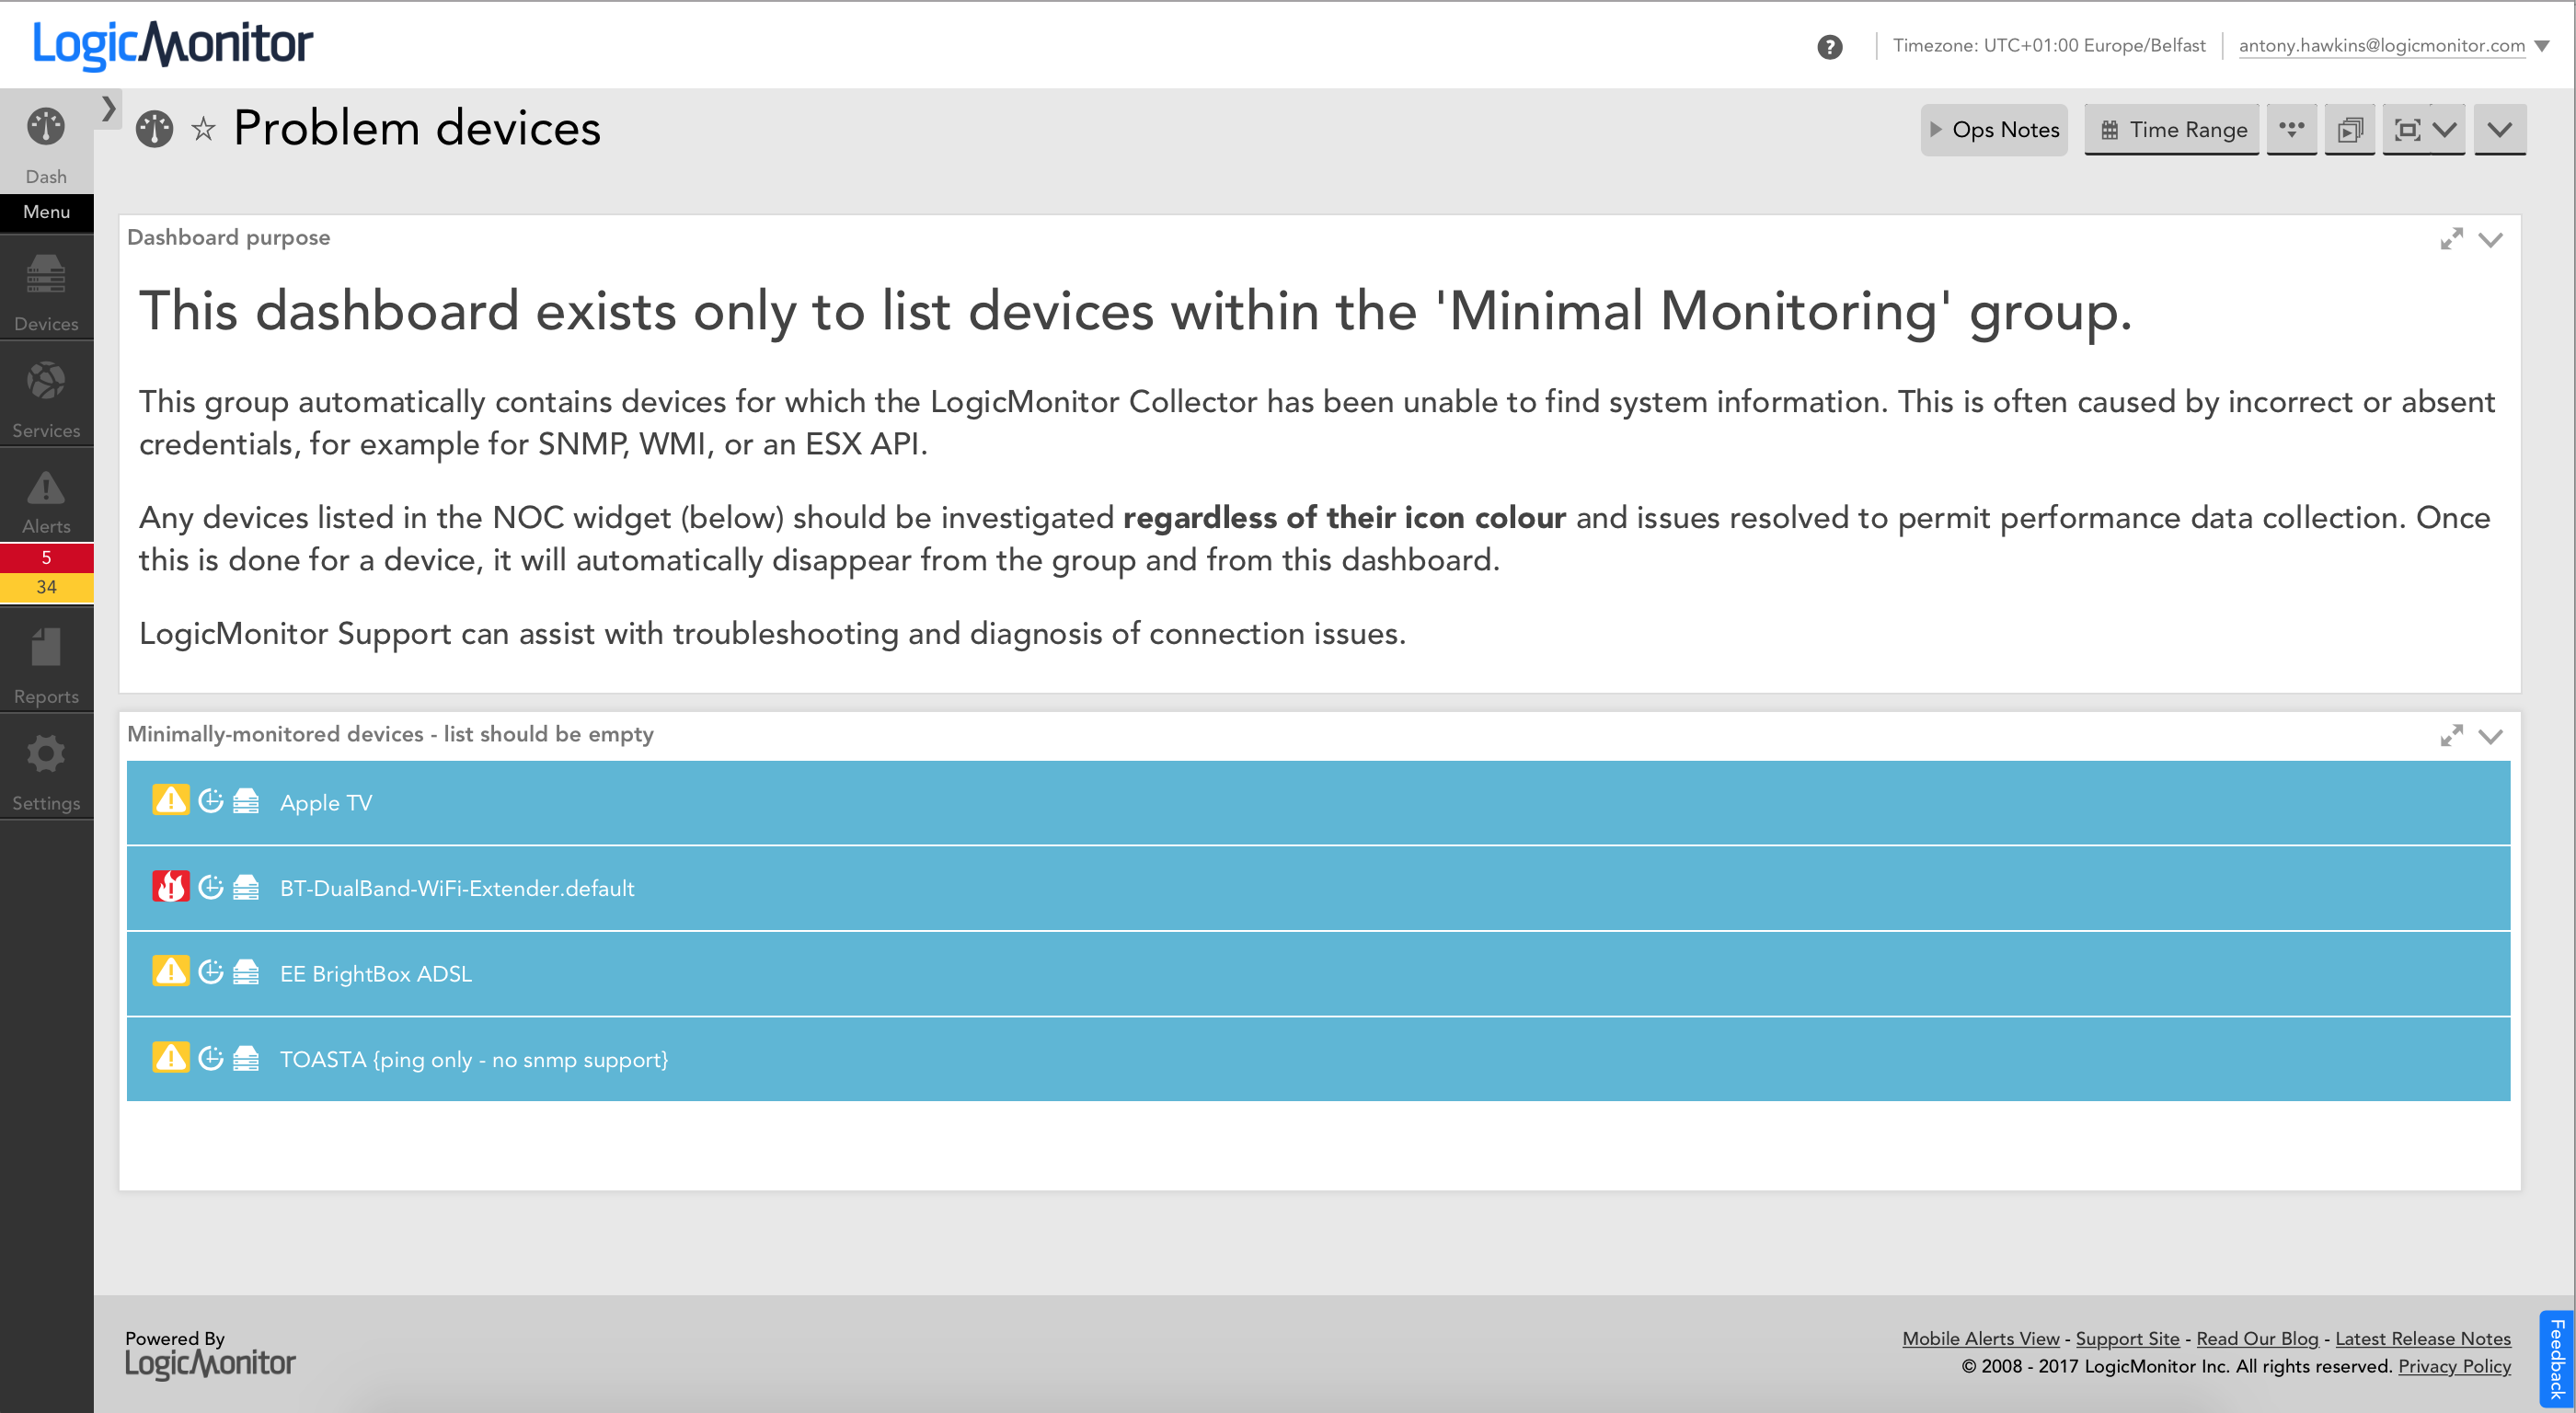
  • With or without alerting, a very simple 'Problem Devices' dashboard is also very easy to construct - just a text widget with an explanation, and a NOC widget listing each device in the 'Minimal Monitoring' device group:

  • @Andrey Kitsen I created the alerter and the dashboard, and have subsequently used them, for cases where a customer has run a netscan on an inadequately-prepared (for LogicMonitor purposes) network, for example where SNMP credentials were unknown or SNMP was not running, resulting in large numbers of unmonitored devices. This is only a small proportion of customers, so I don't have a statistically significant sample to comment on.

    It's probably most useful in large environments with small numbers of non-responsive devices, as these are the cases where a large number of monitored devices in groups can appear to be "everything" - it's easy to overlook the fact that there are a few devices missing from hundreds or thousands across multiple groups. These cases tend to be where a small number of devices have non-standard SNMP configs, etc - maybe their community string differs from what should be the network standard and therefore the group-level snmp.community value doesn't permit a response.

    However, it does have uses in smaller environments, and clearly also if all N00 or N,000 detections from a netscan arrive in Minimal Monitoring, it will quickly flag this up too.

  • On 6/20/2017 at 3:46 AM, Antony Hawkins said:

    @Andrey Kitsen I created the alerter and the dashboard, and have subsequently used them, for cases where a customer has run a netscan on an inadequately-prepared (for LogicMonitor purposes) network, for example where SNMP credentials were unknown or SNMP was not running, resulting in large numbers of unmonitored devices. This is only a small proportion of customers, so I don't have a statistically significant sample to comment on.

    It's probably most useful in large environments with small numbers of non-responsive devices, as these are the cases where a large number of monitored devices in groups can appear to be "everything" - it's easy to overlook the fact that there are a few devices missing from hundreds or thousands across multiple groups. These cases tend to be where a small number of devices have non-standard SNMP configs, etc - maybe their community string differs from what should be the network standard and therefore the group-level snmp.community value doesn't permit a response.

    However, it does have uses in smaller environments, and clearly also if all N00 or N,000 detections from a netscan arrive in Minimal Monitoring, it will quickly flag this up too.


    I'll take note of this. 

  • Wondering why you use: 
    join(system.groups,",") =~ "Minimal Monitoring"

    shouldn't this work:
    contains(system.groups,"Minimal Monitoring")

    I can't get "contains" to work like this though?!  Does it not work in AppliesTo ??

  • Hi Ikvitek,

    In this case, I used:

    join(system.groups,",") =~ "Minimal Monitoring"

    ...purely because, if you use the AppliesTo wizard to select groups to apply a datasource to, this is the format the wizard creates for you.

    You are correct though, the 'contains' method is equally valid and should work. I have successfully tested this in my account:

    contains(system.groups,"Minimal Monitoring")

    If you contact Support they will be able to troubleshoot this for you.

    Please also see my note in my original post, that the 'Minimal Monitoring' dynamic group does not exist in all accounts. It's a problem-catching group that we only invented a year or so back, and like any group it can be deleted. You may also have created your own 'Minimal Monitoring' group for other purposes, so check in your account FIRST, before importing this datasource.

  • 25 minutes ago, Misha Stamenkovic said:

    The LogicModule Locator doesn't work, "Unknown error".


    Hi Misha,

    I've asked someone to take a look into this, thanks for pointing it out.